Fig. 7
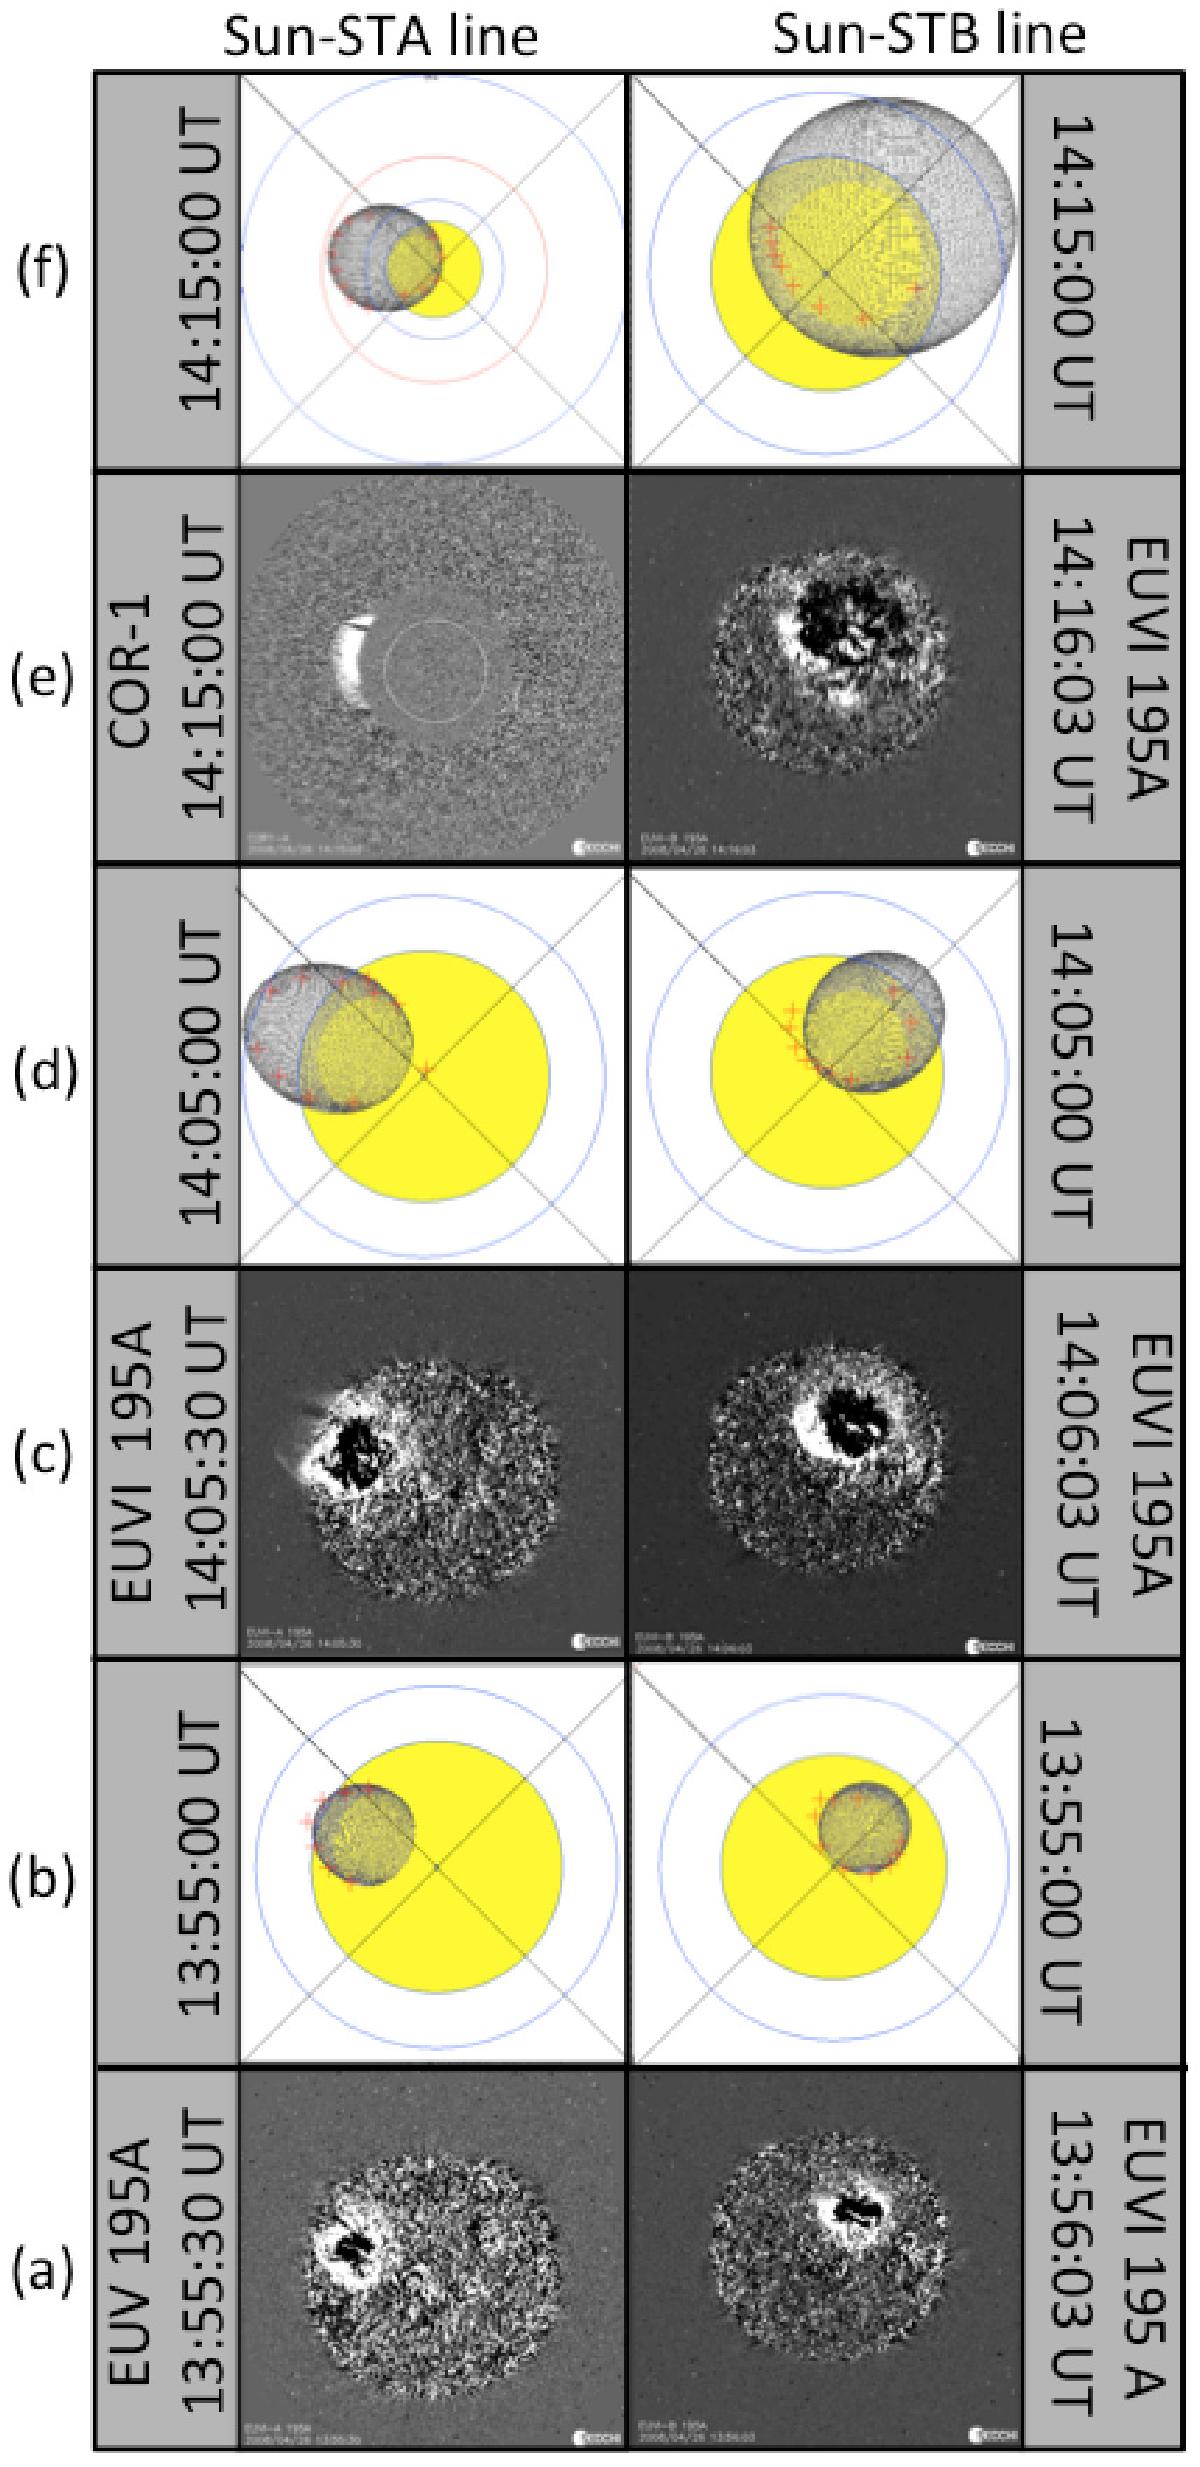
Comparison of running-difference images (rows a), c), e)) of the eruptive event observed by STA (left hand-column) and STB (right-hand column) with the results of applying the fitting technique (rows b), d), f)) developed by Rouillard et al. (2016). The images are all from the EUVI instruments, except the left-hand image shown in row f) obtained by COR1-A. Red crosses superposed on the fitted ellipsoids show the contour of the propagating front observed in the running difference images and are used to constrain the extent and location of the ellipsoid at each time.
Current usage metrics show cumulative count of Article Views (full-text article views including HTML views, PDF and ePub downloads, according to the available data) and Abstracts Views on Vision4Press platform.
Data correspond to usage on the plateform after 2015. The current usage metrics is available 48-96 hours after online publication and is updated daily on week days.
Initial download of the metrics may take a while.