Fig. 4
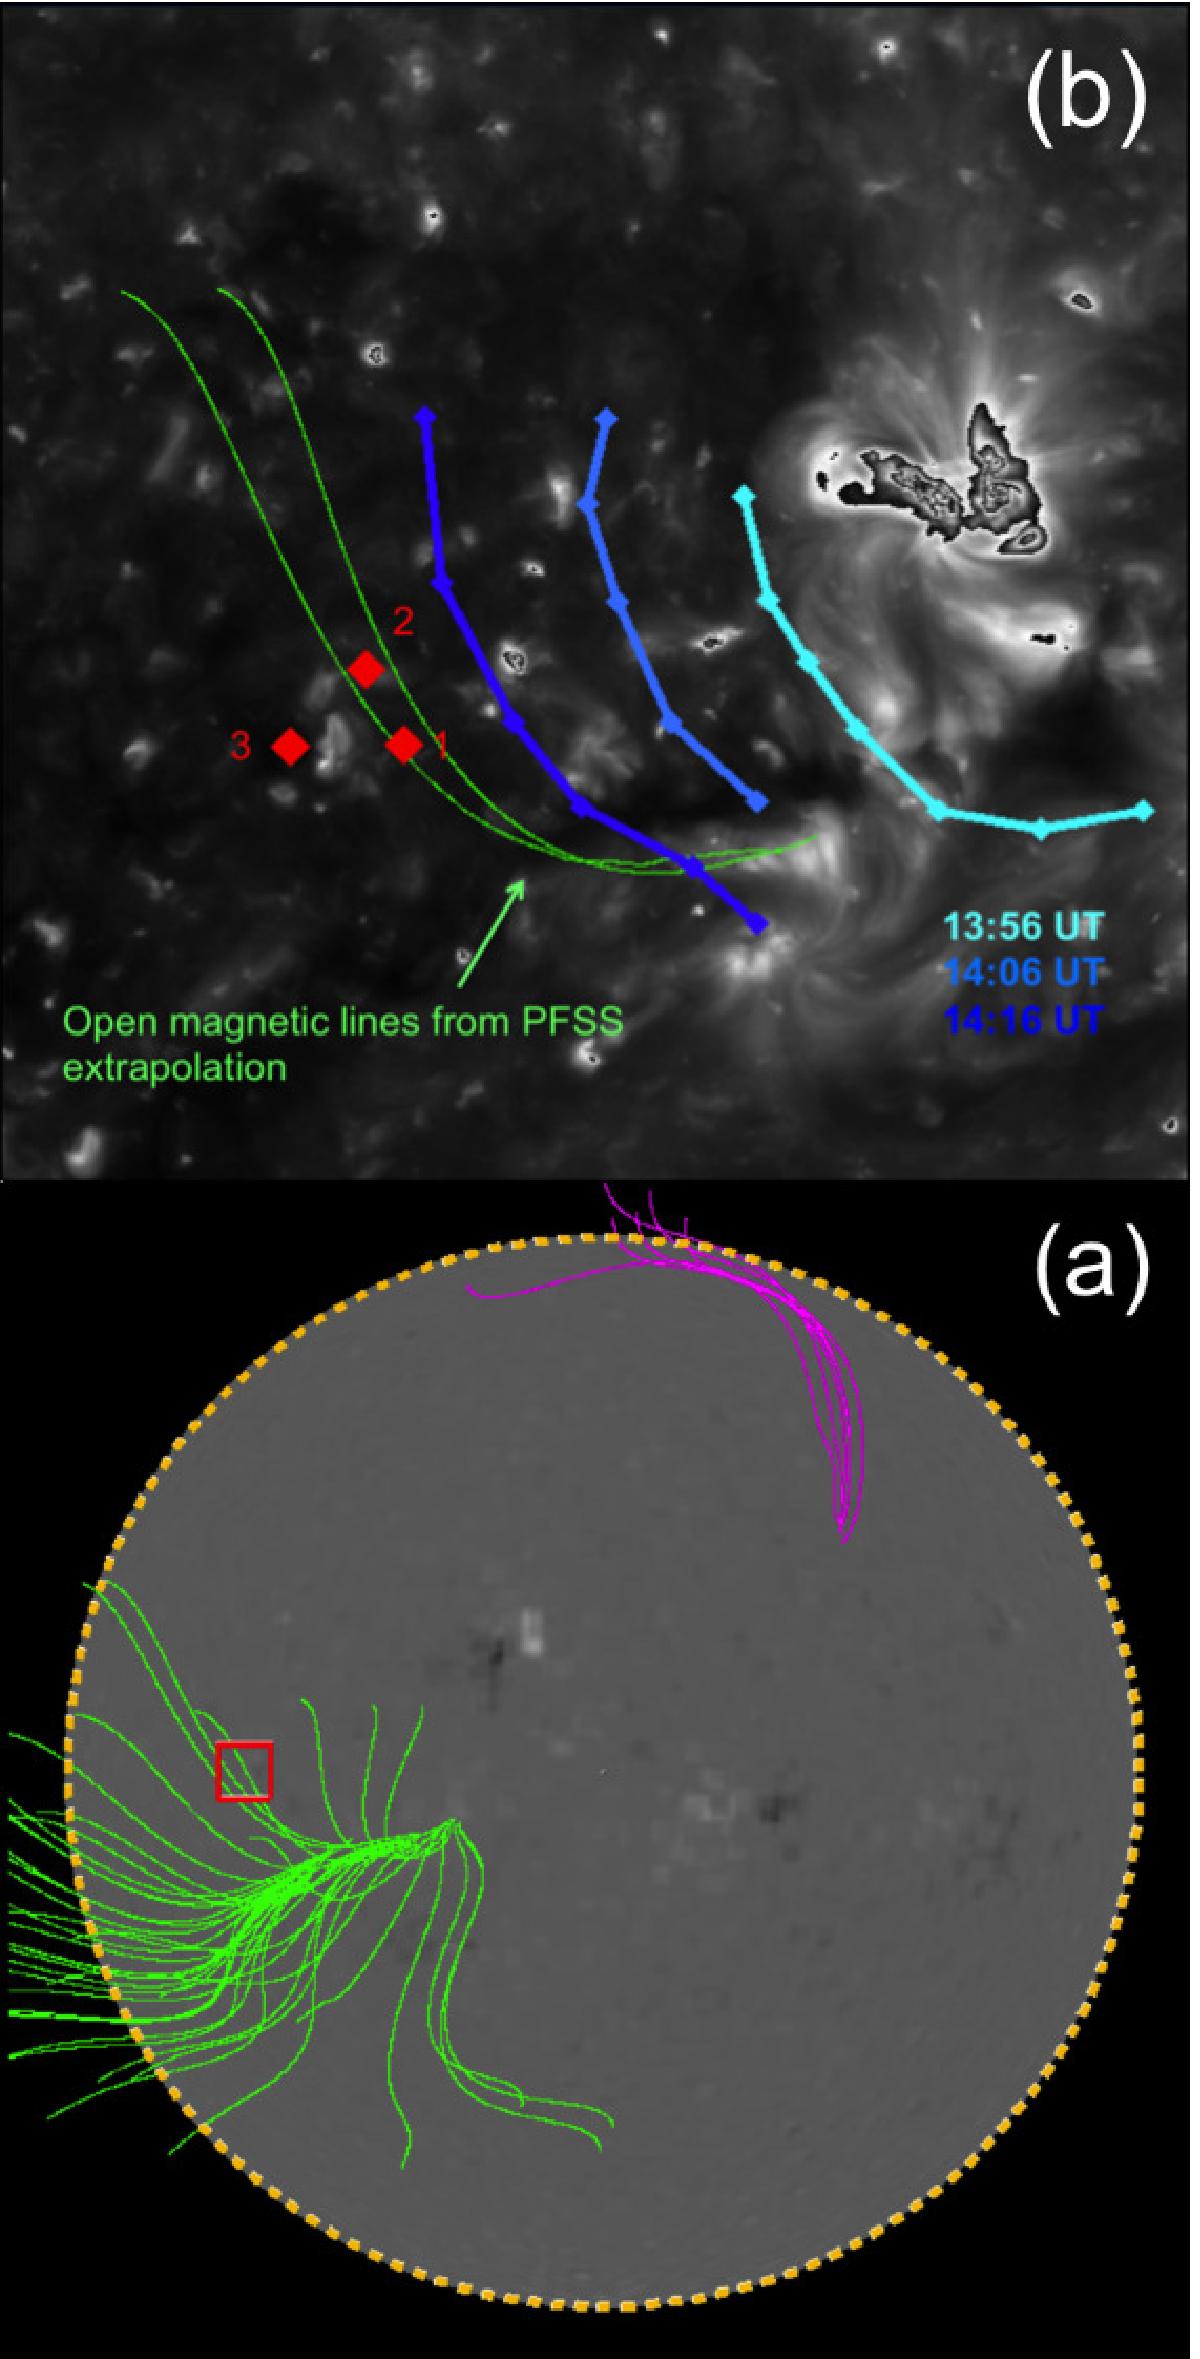
a): Source region of the type III bursts (red square) over the open magnetic field lines (in green) inferred using the PFSS extrapolation model by Schrijver & De Rosa (2003). b): Superposition of two open magnetic field lines (in green) close to the positions of three successive individual type III bursts (red diamonds) on the 19.5 nm EUVI synoptic map from STEREO B. The blue lines outline the EUVI wave front at different times: 13:56, 14:06 (near the time of the type III burst), and 14:16 UT.
Current usage metrics show cumulative count of Article Views (full-text article views including HTML views, PDF and ePub downloads, according to the available data) and Abstracts Views on Vision4Press platform.
Data correspond to usage on the plateform after 2015. The current usage metrics is available 48-96 hours after online publication and is updated daily on week days.
Initial download of the metrics may take a while.