Fig. 3
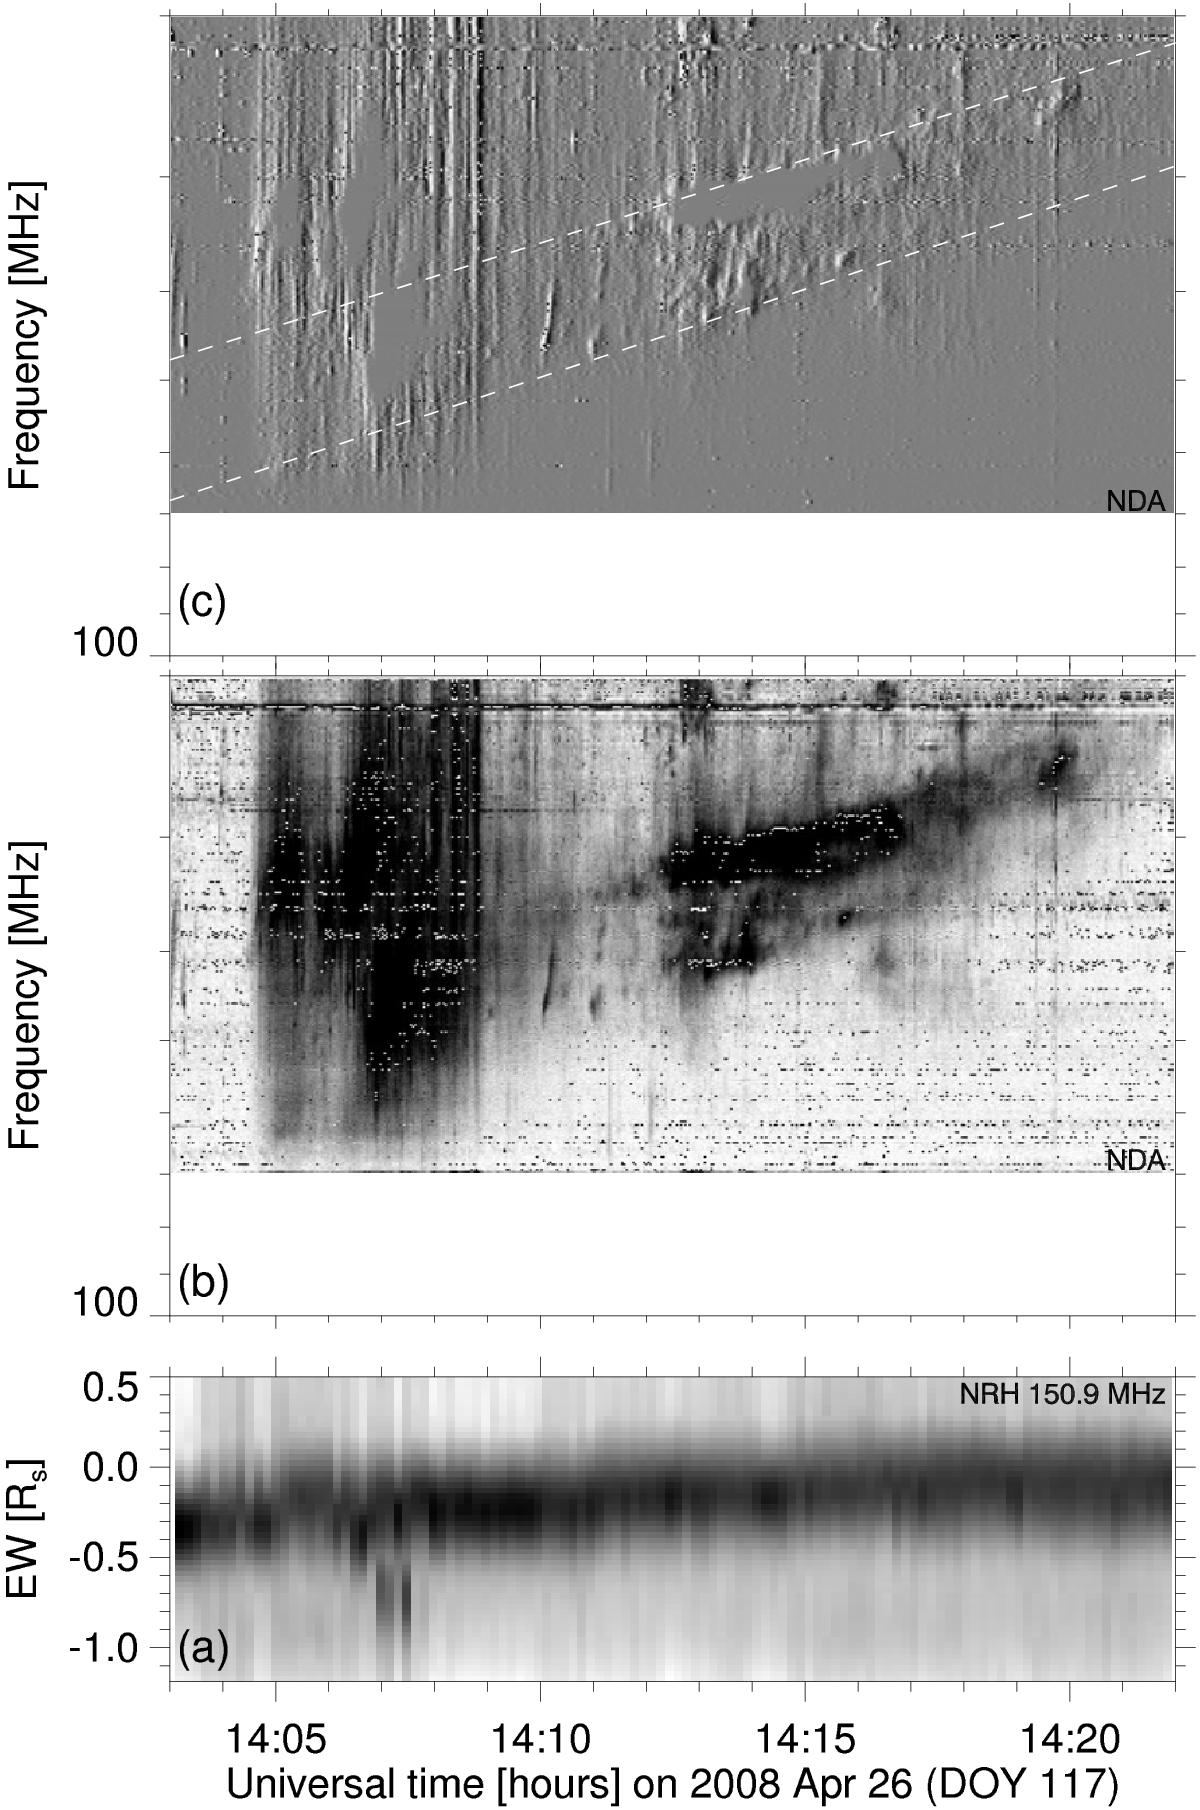
Time history of the metre-wave radio emission during the late type III and type II bursts: a) 1D images projected onto the solar east-west direction at 150 MHz (y-axis graded in solar radii from the eastern to the western limb) showing a continuum emission and a sporadic source on its eastern side at around 14:07 UT, b) dynamic spectrum between 70 and 20 MHz and c) time-difference spectrum of b). The dashed lines are fits of the upper and lower borders of the type II burst in b).
Current usage metrics show cumulative count of Article Views (full-text article views including HTML views, PDF and ePub downloads, according to the available data) and Abstracts Views on Vision4Press platform.
Data correspond to usage on the plateform after 2015. The current usage metrics is available 48-96 hours after online publication and is updated daily on week days.
Initial download of the metrics may take a while.