Open Access
Fig. 2
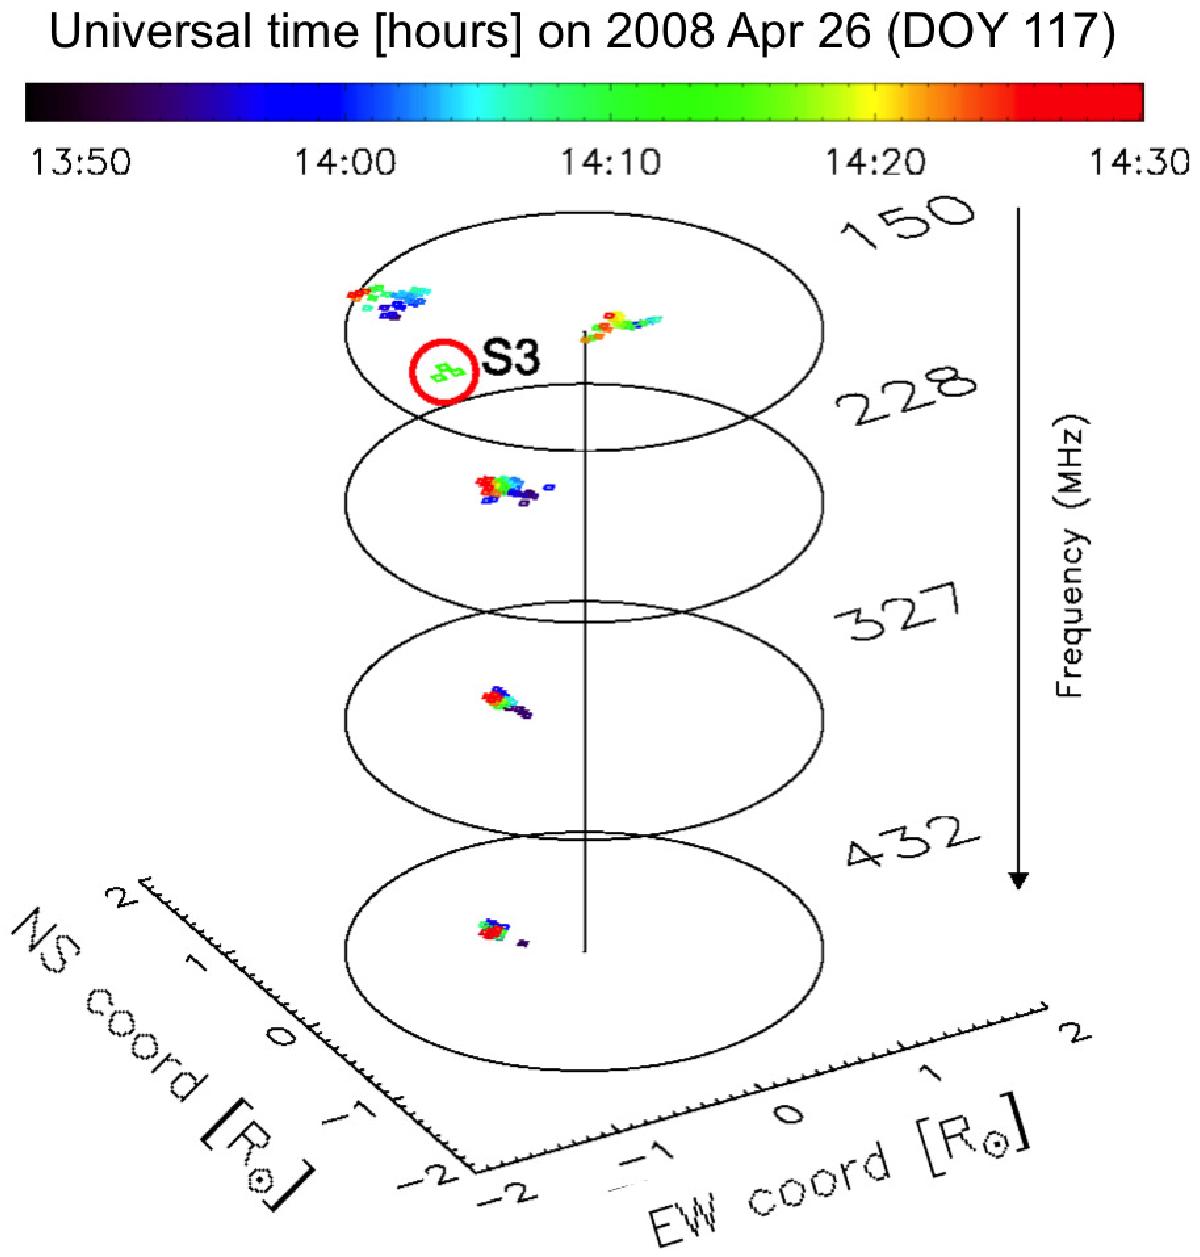
4D multifrequency plot showing the time evolution of the peak position in each image of the NRH at four frequencies. Time is represented by the color of the plot symbol, as indicated in the color bar at the top. The positions of the type III bursts (S3) near 14:07 UT at 150.9 MHz are enclosed in the red circle
Current usage metrics show cumulative count of Article Views (full-text article views including HTML views, PDF and ePub downloads, according to the available data) and Abstracts Views on Vision4Press platform.
Data correspond to usage on the plateform after 2015. The current usage metrics is available 48-96 hours after online publication and is updated daily on week days.
Initial download of the metrics may take a while.