Fig. A.1
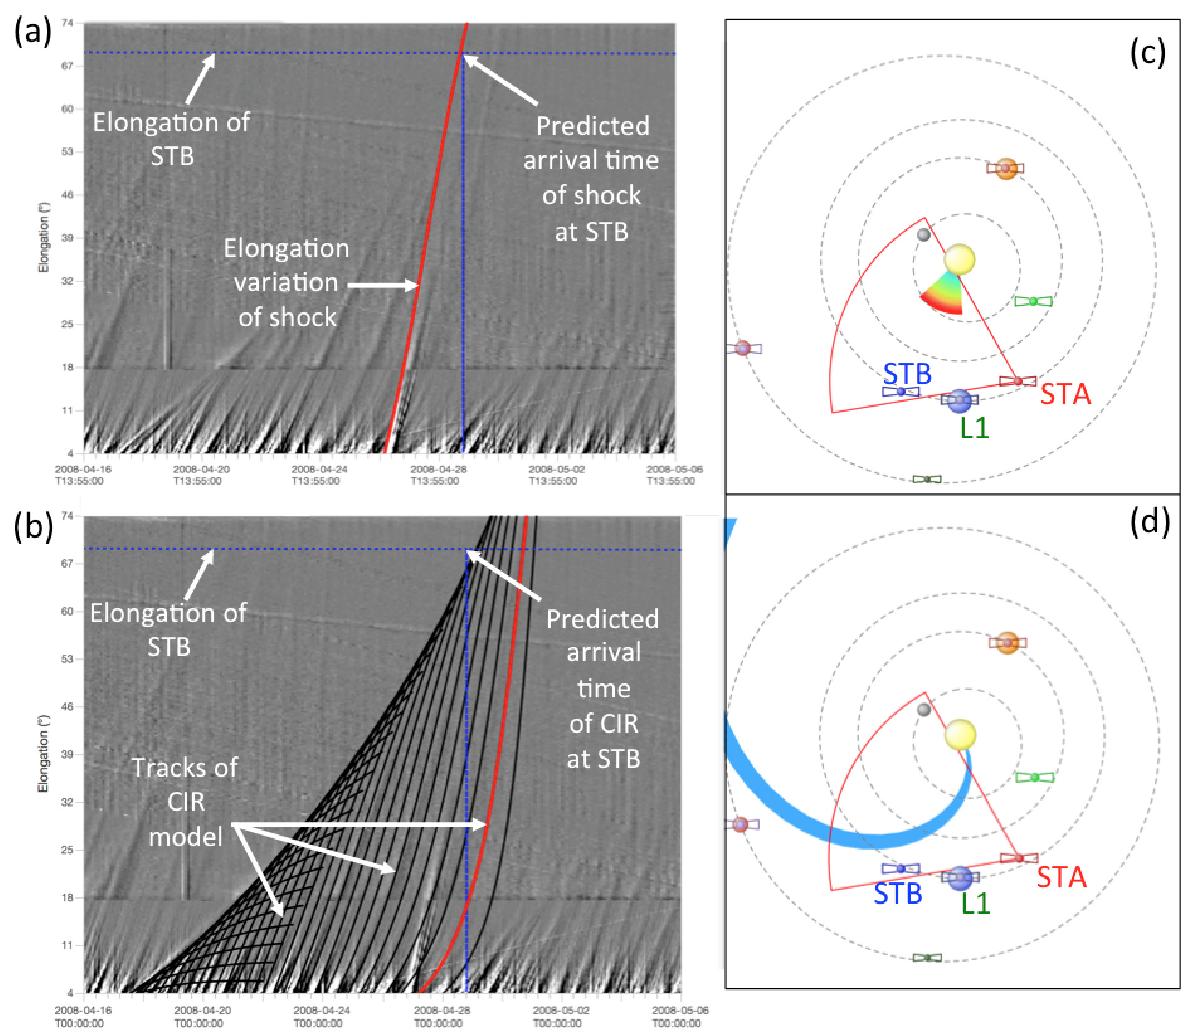
a), b): J-maps derived from heliospheric imaging made by STEREO-A showing the state of the interplanetary medium between 16 April and 6 May 2008. Each track on these J-maps corresponds to a density structure moving radially outward from the Sun and leaving a strong signature in the white-light images. The horizontal dotted line near the top of the maps shows the elongation of STEREO-B (STB). The inclined red line in a) is the track of a hypothetical CME launched near the time of the 26 April 2008 event and propagating at constant speed 550 km s-1. The vertical blue line marks its arrival at STB. c), d): view of the ecliptic plane from solar north with the respective locations of STEREO-A (STA), STB and L1 as well as other planets and probes that are not all labeled for clarity purposes. The angular extents of the J-maps shown in the left-hand columns are shown as red contour lines emanating from the STA. The locations of the CME (c) and CIR (d); blue band) derived by the J-map analysis are shown at 12:00 UT on 27 April 2008. These four panels were produced using the IRAP propagation tool (propagationtool.cdpp.eu).
Current usage metrics show cumulative count of Article Views (full-text article views including HTML views, PDF and ePub downloads, according to the available data) and Abstracts Views on Vision4Press platform.
Data correspond to usage on the plateform after 2015. The current usage metrics is available 48-96 hours after online publication and is updated daily on week days.
Initial download of the metrics may take a while.