Open Access
Fig. 10
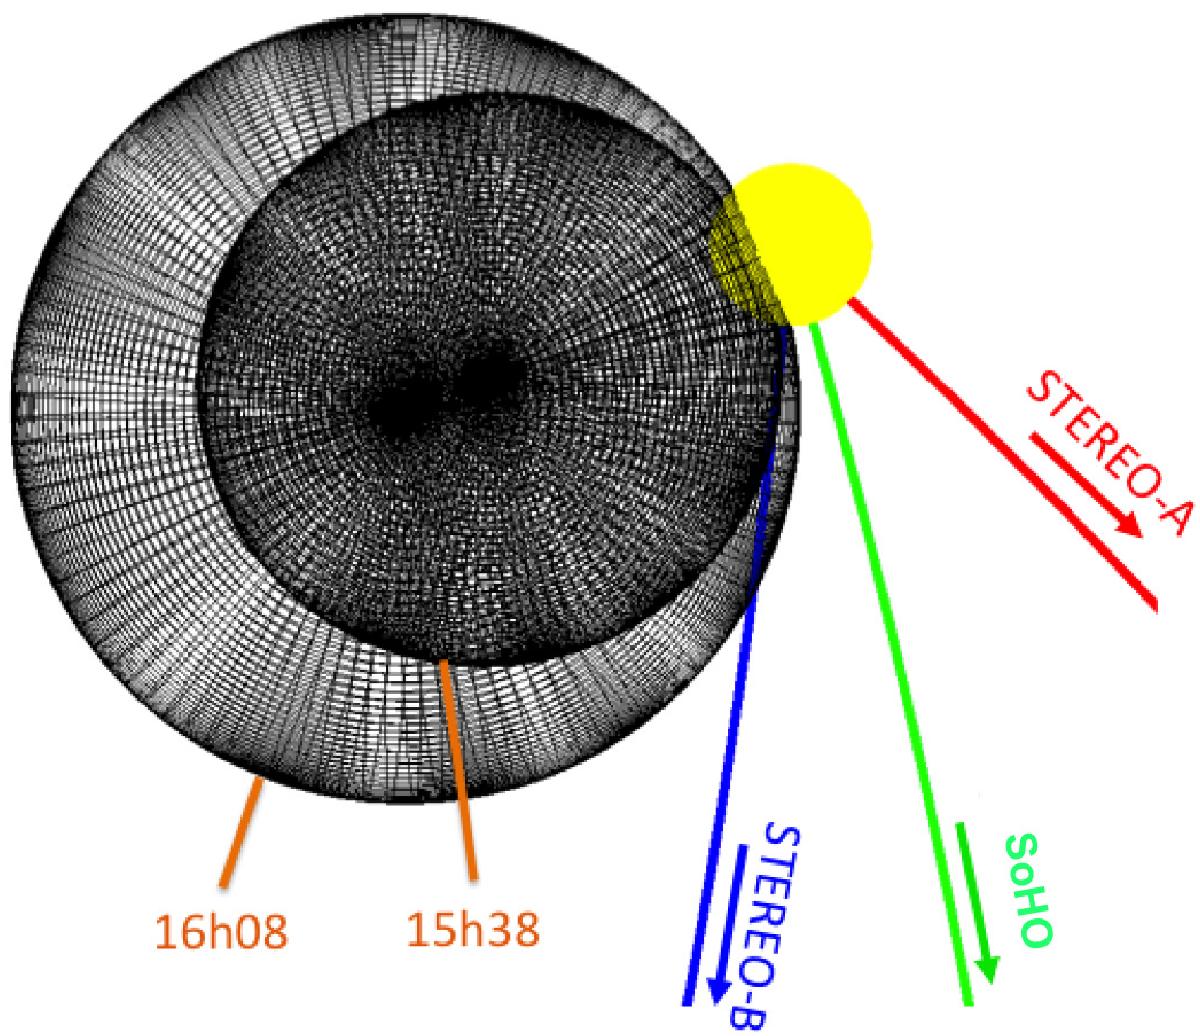
Pressure wave triangulated from STEREO/COR2 observations at 15:38 UT and at 16:08 UT, as seen by an observer above the northern solar pole. The three labeled lines represent the Parker spiral field lines in the ecliptic plane that connect the parent active region to the spacecraft.
Current usage metrics show cumulative count of Article Views (full-text article views including HTML views, PDF and ePub downloads, according to the available data) and Abstracts Views on Vision4Press platform.
Data correspond to usage on the plateform after 2015. The current usage metrics is available 48-96 hours after online publication and is updated daily on week days.
Initial download of the metrics may take a while.