Fig. 6
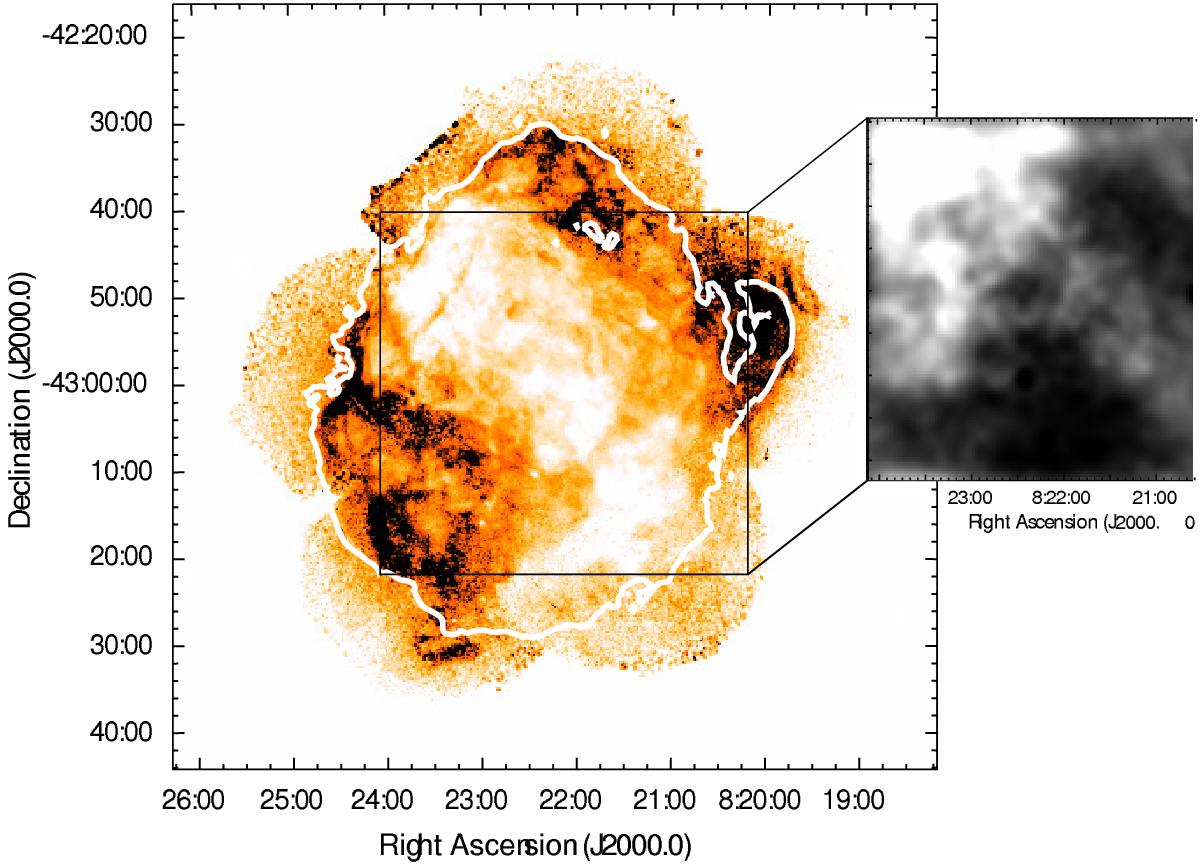
Hardness ratio (0.3−0.7/1.0−8.0 keV) image. The clear stripe crossing the remnant from northeast to southwest follows those regions where the hardness ratio and the intervening absorption column are higher. White contours show the continuum at radio wavelengths that delineate the SNR shock front. The inset shows distribution of NH integrated between 0 and 16.1 km s-1, which is the systemic velocity of Puppis A. The HI data were obtained by Reynoso et al. (2003) (compare with Fig. 3 in D13).
Current usage metrics show cumulative count of Article Views (full-text article views including HTML views, PDF and ePub downloads, according to the available data) and Abstracts Views on Vision4Press platform.
Data correspond to usage on the plateform after 2015. The current usage metrics is available 48-96 hours after online publication and is updated daily on week days.
Initial download of the metrics may take a while.