Fig. 5
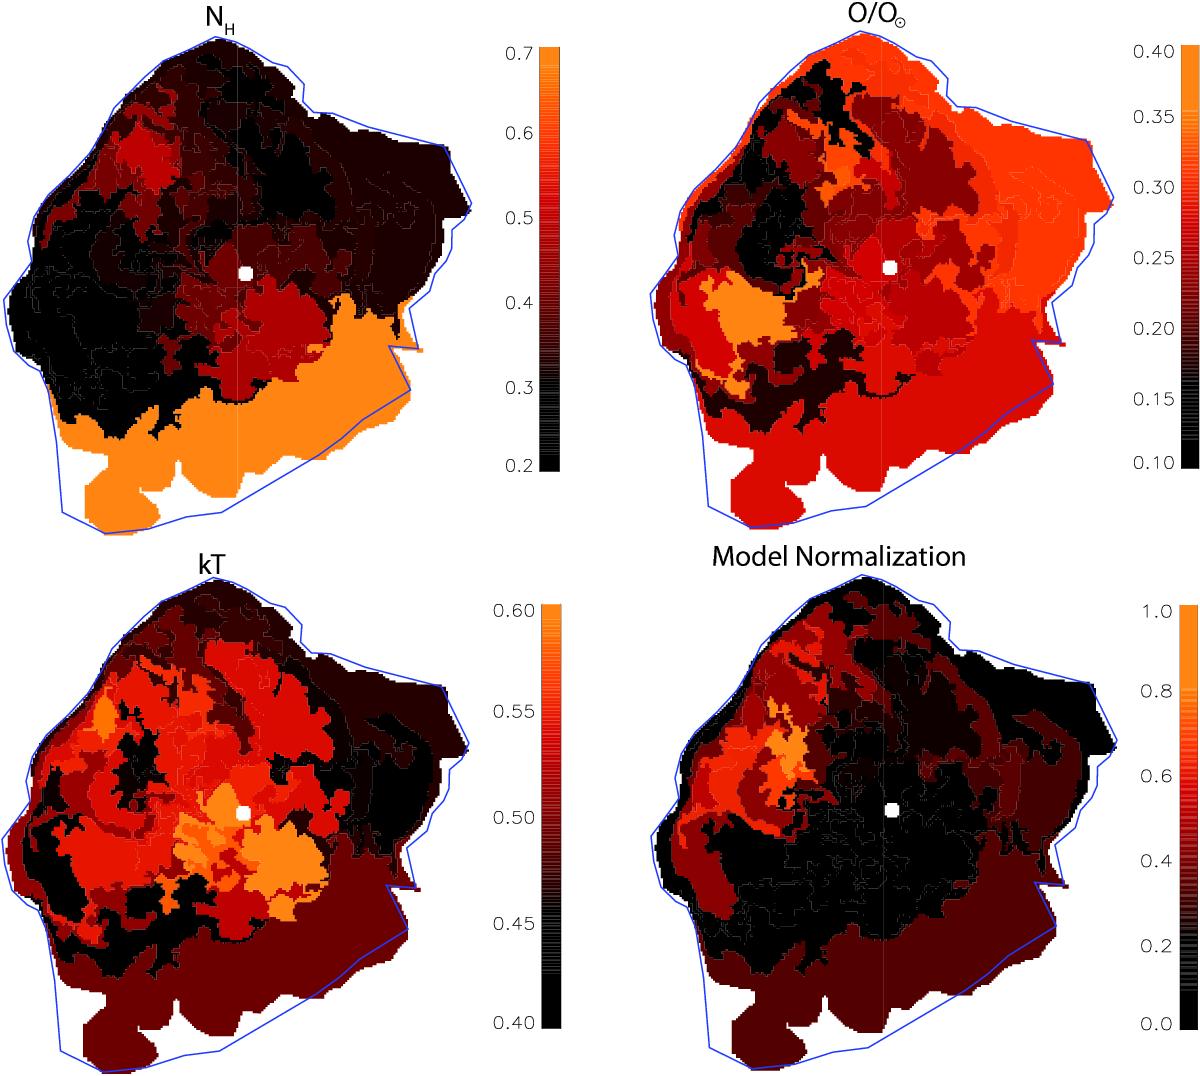
Sample color-coded maps of the spatial distribution of the parameters from the spectral fits. From left to right, this figure shows the spatial distribution of the shock temperature, kT, NH, O/O⊙ abundance, and vpshock normalization (proportional to the plasma emission measure, ∫nenHdV, where ne and nH are the electron and hydrogen densities, respectively).
Current usage metrics show cumulative count of Article Views (full-text article views including HTML views, PDF and ePub downloads, according to the available data) and Abstracts Views on Vision4Press platform.
Data correspond to usage on the plateform after 2015. The current usage metrics is available 48-96 hours after online publication and is updated daily on week days.
Initial download of the metrics may take a while.