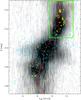
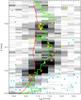
Fig. 9

Left: zoom-in of position-velocity diagram shown in Fig. 8. Green box indicates the area in the diagram on the right. Right: N2H+ position-velocity diagram of the northern portion of the ISF. Red line is the 13CO gas ridgeline while the green line shows thevelocity centroid of the N2H+ line. The protostars (yellow ×-symbols) have velocities that are slightly displaced from the CO gas but directly associated with N2H+. Ordinate is δ [deg].
Current usage metrics show cumulative count of Article Views (full-text article views including HTML views, PDF and ePub downloads, according to the available data) and Abstracts Views on Vision4Press platform.
Data correspond to usage on the plateform after 2015. The current usage metrics is available 48-96 hours after online publication and is updated daily on week days.
Initial download of the metrics may take a while.