Free Access
Fig. 9
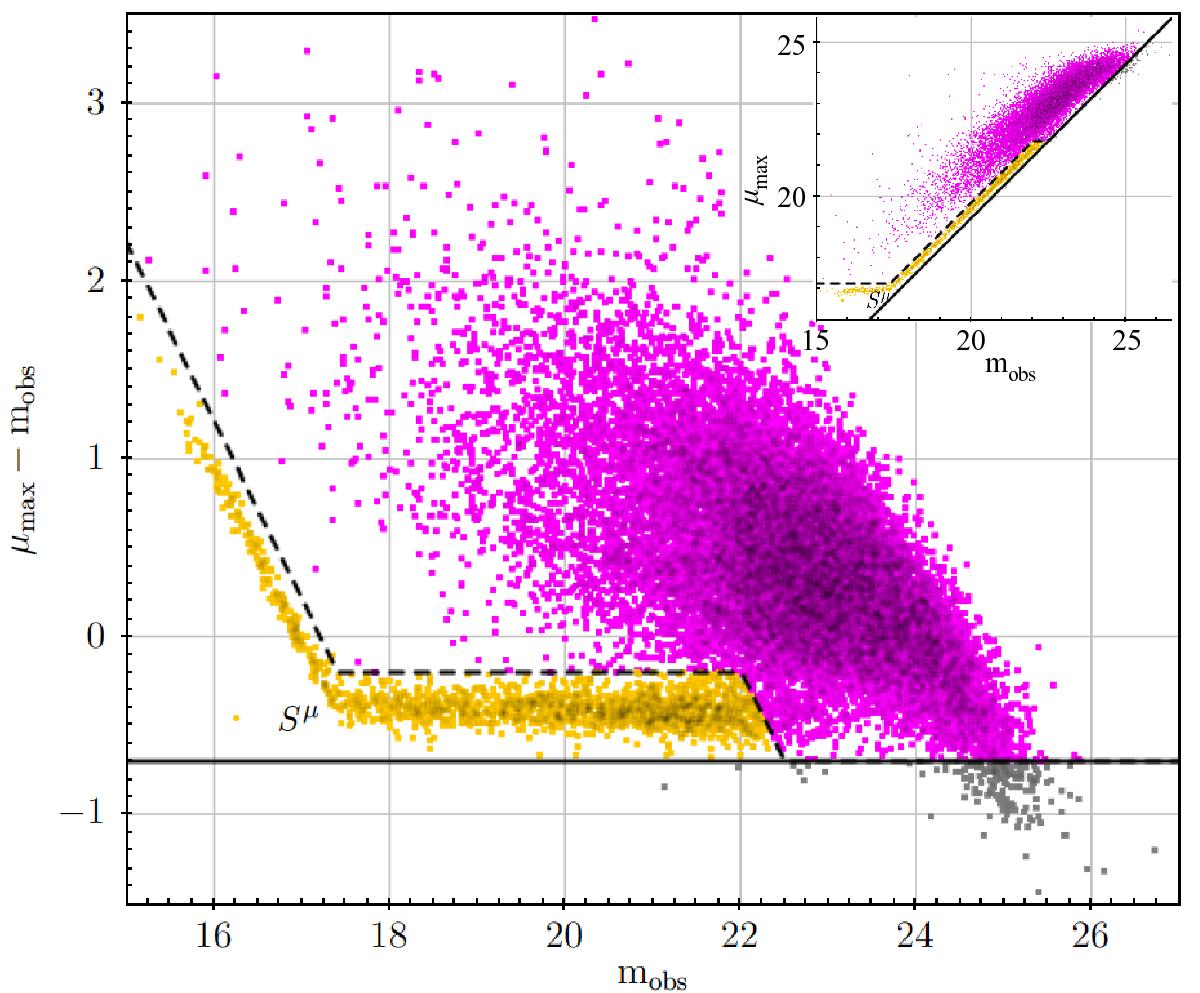
Photometric classification between point-like and extended sources in the μmax−mobs vs. mobs plane (for one tile of the CFHTLS in the i-band). The dashed line represents our selection of point-like sources (Sμ, yellow dots). All objects lying below the solid line (gray dots) are considered as false detections.
Current usage metrics show cumulative count of Article Views (full-text article views including HTML views, PDF and ePub downloads, according to the available data) and Abstracts Views on Vision4Press platform.
Data correspond to usage on the plateform after 2015. The current usage metrics is available 48-96 hours after online publication and is updated daily on week days.
Initial download of the metrics may take a while.