Free Access
Fig. 6
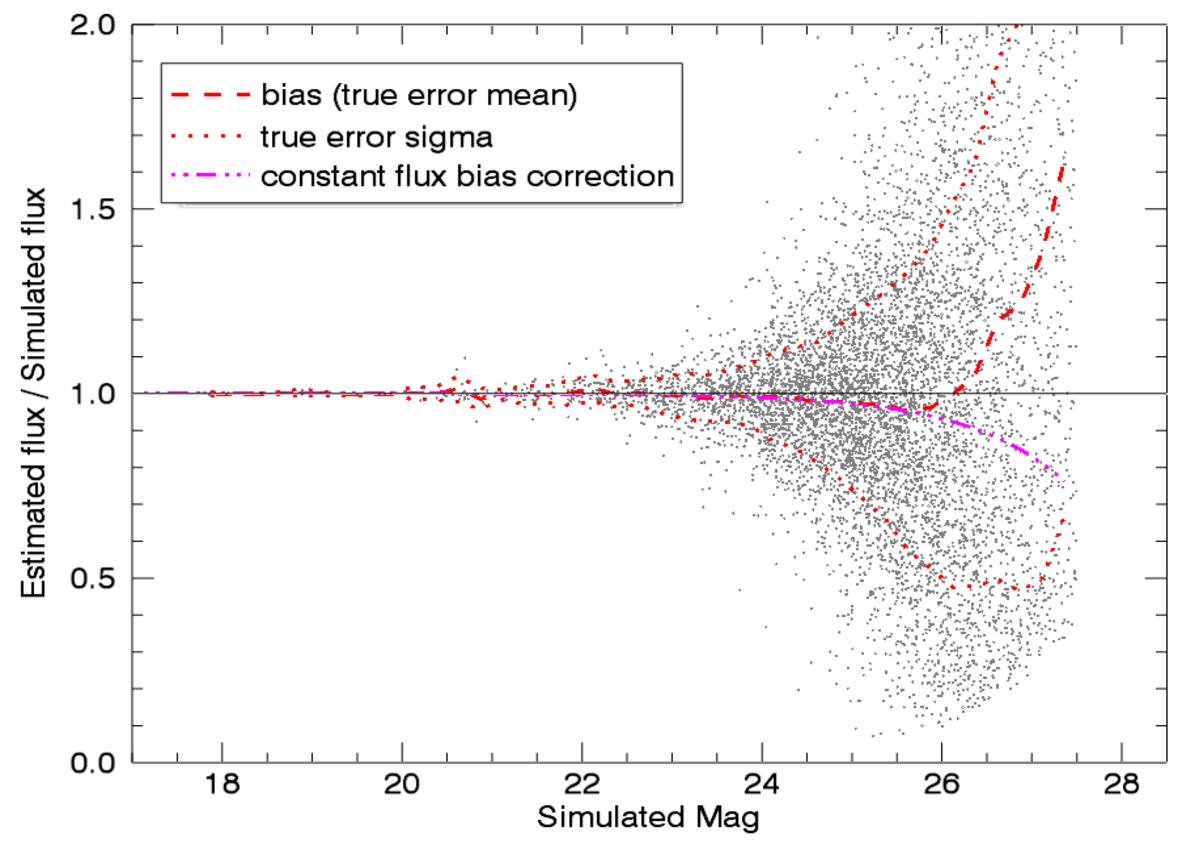
Comparison of the EM vs. simulated fluxes as a function of simulated magnitudes. The dotted lines show the 1σ error, the red dashed line the mean bias. The magenta dot-dashed line reflects the effect of a small background bias on the flux ratio.
Current usage metrics show cumulative count of Article Views (full-text article views including HTML views, PDF and ePub downloads, according to the available data) and Abstracts Views on Vision4Press platform.
Data correspond to usage on the plateform after 2015. The current usage metrics is available 48-96 hours after online publication and is updated daily on week days.
Initial download of the metrics may take a while.