Fig. 13
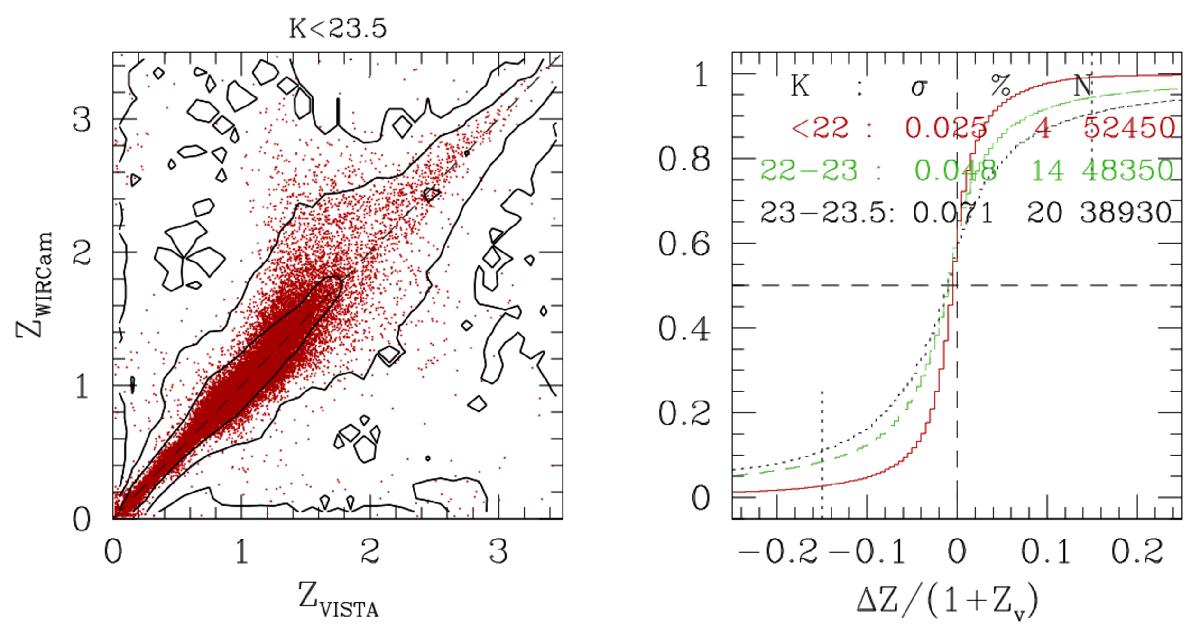
Comparison of the photometric redshifts measured using either WIRCam K band (zwircam) or YJHK photometry from VISTA (zvista) for galaxies with KVISTA ≤ 23.5. The left panel shows the comparison zwircam vs. zvista for KVISTA < 22 (red dots), while the density contours spaced in logarithmic scale of 1 dex are for the faint sample, 22 < KVISTA < 23.5. The right panel shows the cumulative distributions of the difference (Δz/ (1 + zvista)) split into three K-band subsamples (KVISTA ≤ 22: red line; 22 < KVISTA < 23: green line; 23 < KVISTA < 23.5: red line). We also report the dispersions (σ), the fractions of catastrophic sources (in %), and the number of sources used.
Current usage metrics show cumulative count of Article Views (full-text article views including HTML views, PDF and ePub downloads, according to the available data) and Abstracts Views on Vision4Press platform.
Data correspond to usage on the plateform after 2015. The current usage metrics is available 48-96 hours after online publication and is updated daily on week days.
Initial download of the metrics may take a while.