Fig. 12
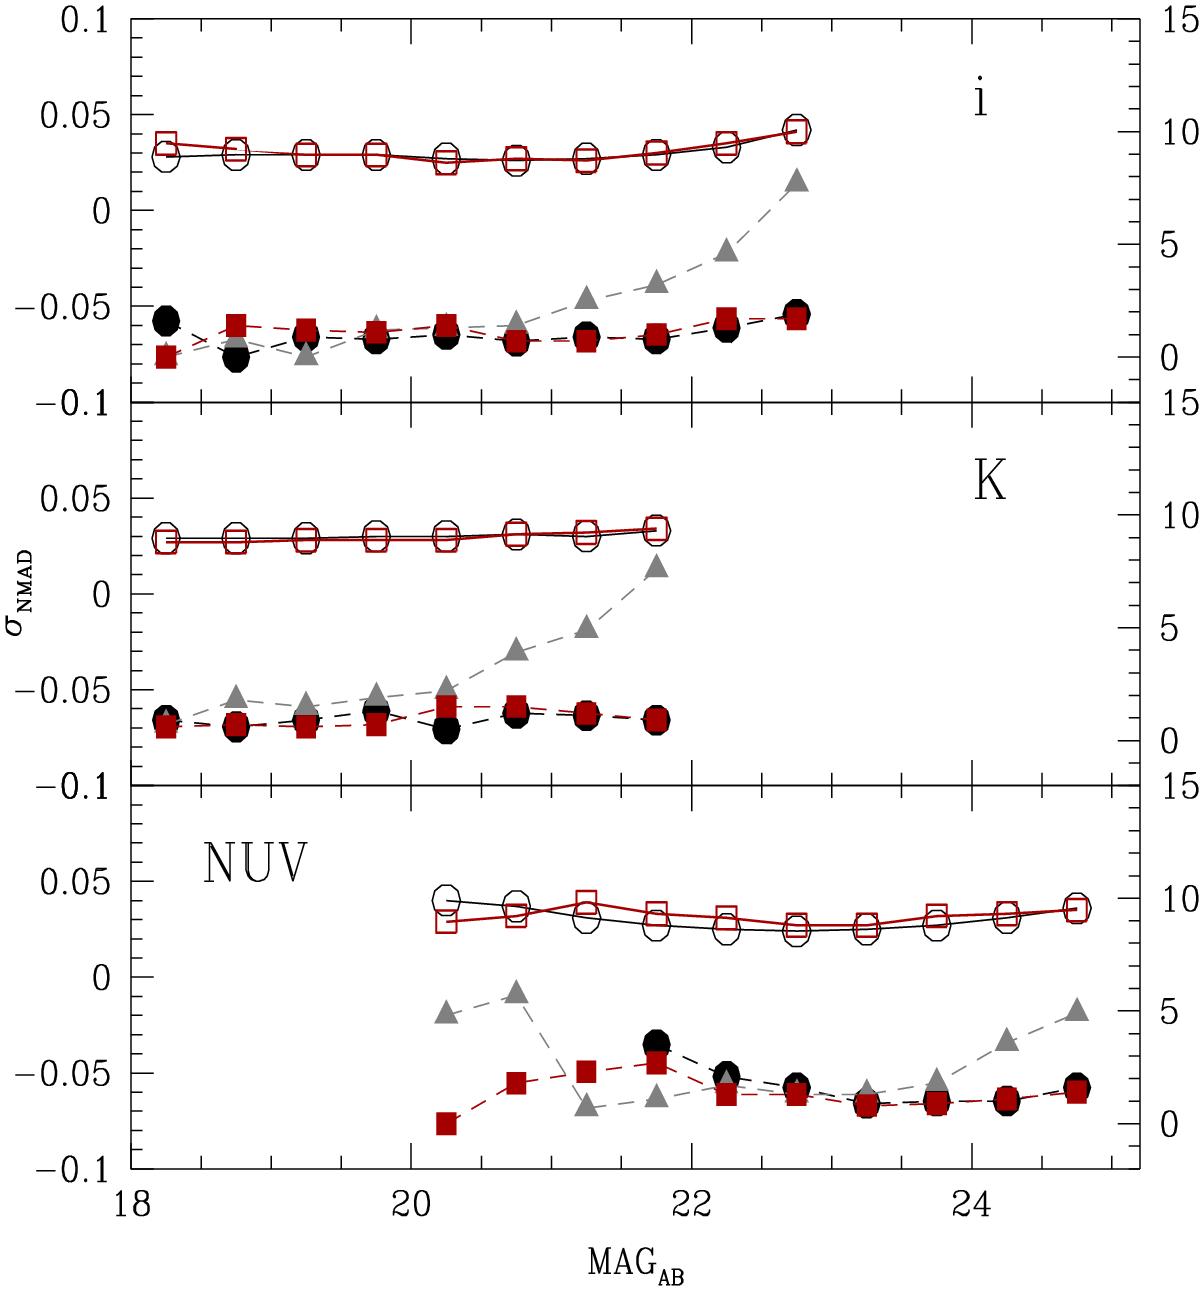
Comparison of the dispersion (σNMAD) as a function of magnitude (top panel: i; middle panel: Ks; bottom panel: NUV). The σNMAD for the W1 (black circles) and W4 (red squares) fields correspond to the open symbols and solid lines and refer to the left y-axis. The fraction of catastrophic redshifts are reported as field symbols and dashed lines and refer to the right y-axis (%). The PRIMUS spectroscopic sample in W1 field is shown separately (gray triangles).
Current usage metrics show cumulative count of Article Views (full-text article views including HTML views, PDF and ePub downloads, according to the available data) and Abstracts Views on Vision4Press platform.
Data correspond to usage on the plateform after 2015. The current usage metrics is available 48-96 hours after online publication and is updated daily on week days.
Initial download of the metrics may take a while.