Fig. 9
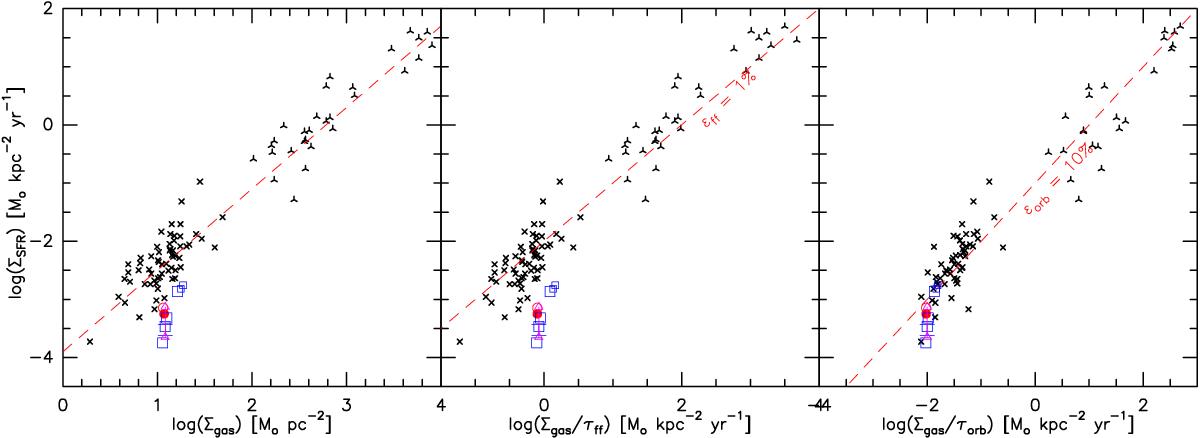
SFR surface density as a function of the total (H2+HI+He) gas surface density (left panel), gas surface density per free-fall time (middle panel) and gas surface density per orbital timescale (right panel). The values for VCC 2062 (red, magenta and blue) are labelled as in Fig. 8. The SFR has been calculated with different tracers (see Sect. 5 and Table 5). Left: the values for VCC 2062 are compared to the sample of Kennicutt (1998). Middle: the surface density of the SFR is compared to the molecular surface density per free free-fall time, following Krumholz et al. (2012). The values for VCC 2062 are compared to the sample of Kennicutt (1998). The red dashed line gives the relation for a 1% efficiency, the value that Krumholz et al. (2012) find to describe the data well. Right: the surface density of the SFR is compared to the molecular surface density per orbital times scale. A value of τorb = 1.2 × 10⁹ yr (Lelli et al. 2015) is adopted for VCC 2062. The comparison sample is from Kennicutt (1998). The red dashed line gives the relation for a 10% efficiency, the value that Kennicutt (1998) find as their average value.
Current usage metrics show cumulative count of Article Views (full-text article views including HTML views, PDF and ePub downloads, according to the available data) and Abstracts Views on Vision4Press platform.
Data correspond to usage on the plateform after 2015. The current usage metrics is available 48-96 hours after online publication and is updated daily on week days.
Initial download of the metrics may take a while.