Fig. 8
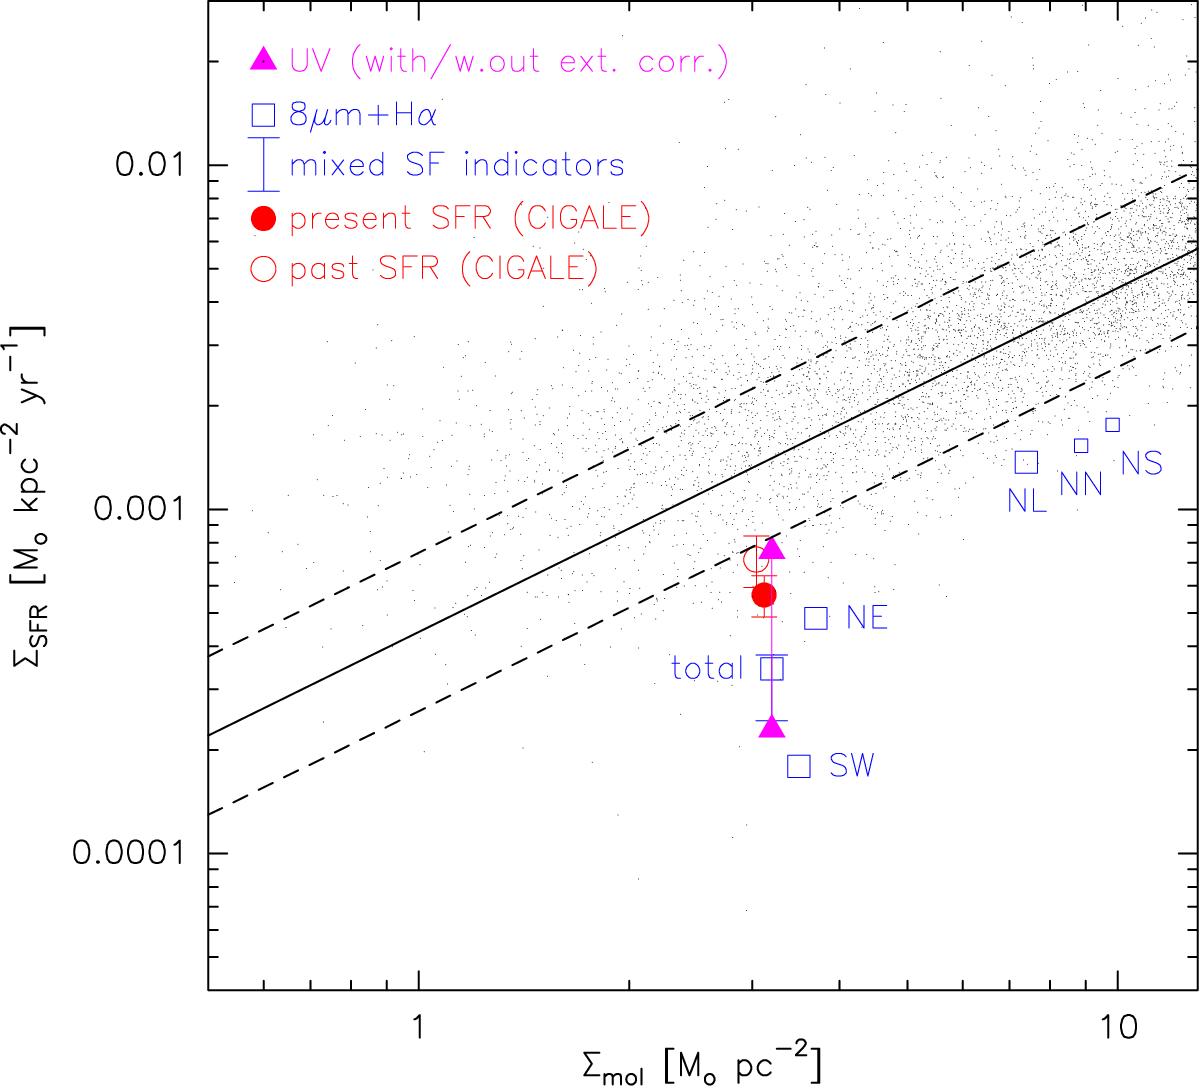
SFR surface density as a function of the molecular gas surface density. The values are calculated for the NE cloud, the SW cloud, the total area where CO is detected (see Fig. 3 for the apertures), as well as for smaller apertures centred on the peaks of the 8 μm emission in the NE cloud (see Fig. 6 for the apertures, labelled here NL, NN and NS for the largest aperture, northern and southern apertures, respectively). The data of VCC 2062 compared to the results of a spatially resolved analysis of HERACLES galaxies (Bigiel et al. 2011). The black dots are their data points obtained at a 1 kpc angular resolution, the solid black line shows their best-fit relation obtained and the dashed line its standard deviation.
Current usage metrics show cumulative count of Article Views (full-text article views including HTML views, PDF and ePub downloads, according to the available data) and Abstracts Views on Vision4Press platform.
Data correspond to usage on the plateform after 2015. The current usage metrics is available 48-96 hours after online publication and is updated daily on week days.
Initial download of the metrics may take a while.