Fig. 5
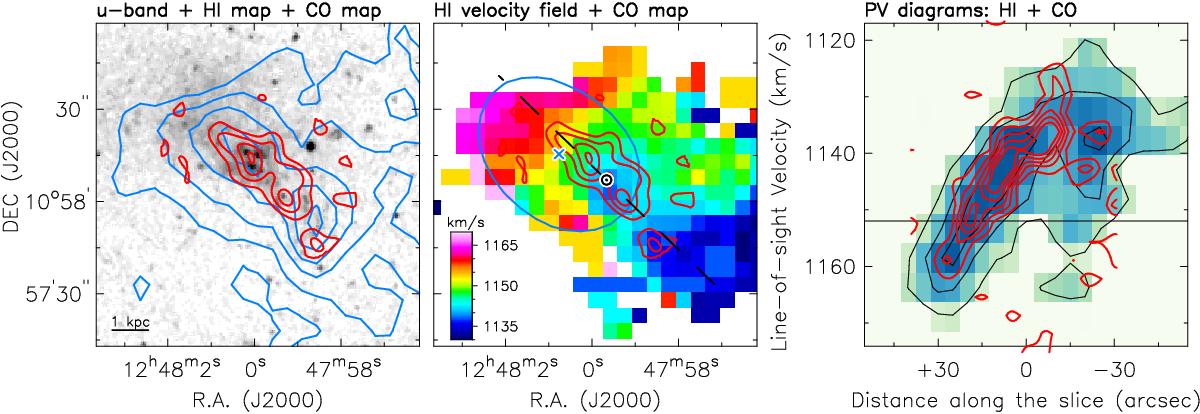
Left panel: u-band image overlayed with the CO (red contours) and HI emission (blue contours). CO contours are at ~0.2, 0.4, 0.6 and 0.8 Jy km s-1 beam-1, corresponding to Σmol~ 2. 4, 6 and 8 M⊙ pc-2. HI contours are at Σatom~ 2, 4, 6, and 8 M⊙ pc-2. The bar to the bottom-left corner corresponds to 1 kpc. Middle panel: HI velocity field overlayed with the CO emission (contours are the same as in the left panel). The blue cross and ellipse illustrate, respectively, the centre and extent of the HI disc investigated by Lelli et al. (2015). The black circle and dashed line show, respectively, the centre and orientation of the slice used to obtain the PV diagrams. Right panel: PV diagrams obtained from the HI and CO cubes along the dashed line in the middle panel. Contours range from 3 to 15σ in steps of 3σ, where σ = 4.5 mJy beam-1 for CO data (red) and σ = 0.6 mJy beam-1 for HI data (black). The horizontal line corresponds to the systemic velocity of the HI disc.
Current usage metrics show cumulative count of Article Views (full-text article views including HTML views, PDF and ePub downloads, according to the available data) and Abstracts Views on Vision4Press platform.
Data correspond to usage on the plateform after 2015. The current usage metrics is available 48-96 hours after online publication and is updated daily on week days.
Initial download of the metrics may take a while.