Fig. 1
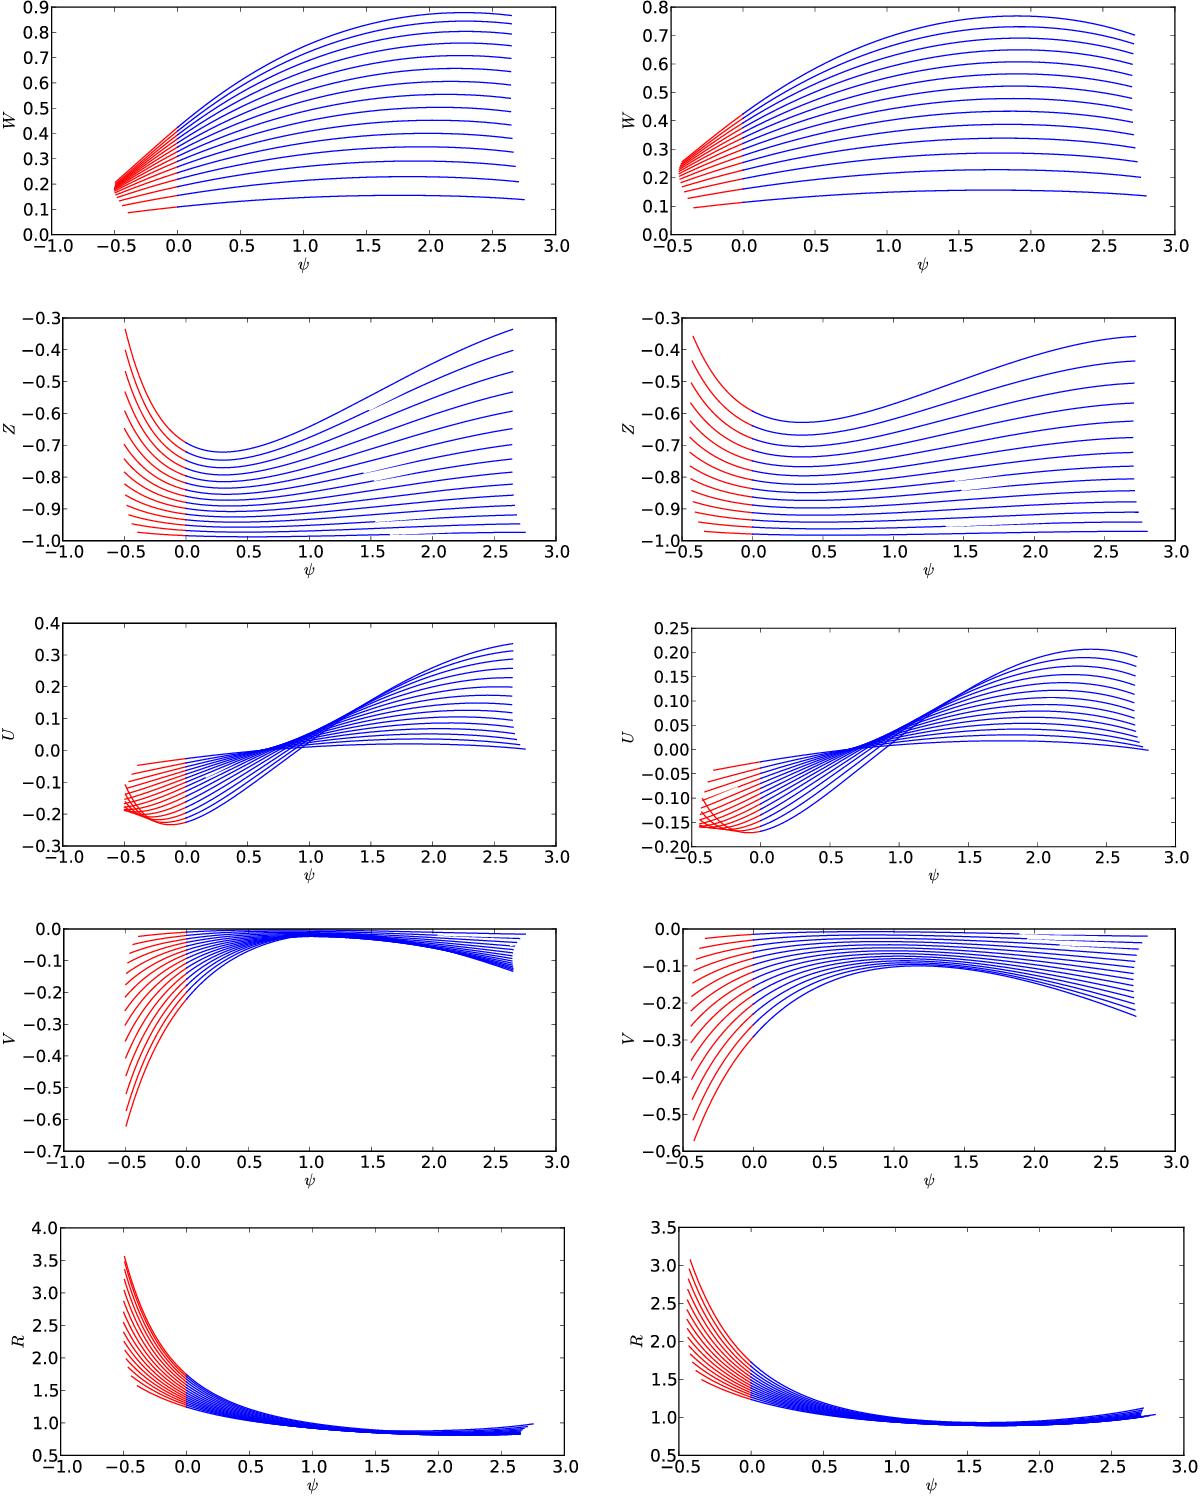
Mode m = 2 for n = 1 / 2 (left) and for n = 1 (right). Various fields for a series of temperatures equally spaced between T0 = 0.18 (corresponding to the curves with more pronounced variations) and T0 = 0.012 (corresponding to flatter curves). The red parts of the curve correspond to the subsonic and the blue parts to the supersonic regions.
Current usage metrics show cumulative count of Article Views (full-text article views including HTML views, PDF and ePub downloads, according to the available data) and Abstracts Views on Vision4Press platform.
Data correspond to usage on the plateform after 2015. The current usage metrics is available 48-96 hours after online publication and is updated daily on week days.
Initial download of the metrics may take a while.