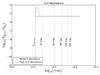
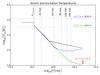
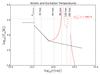
Fig. 9
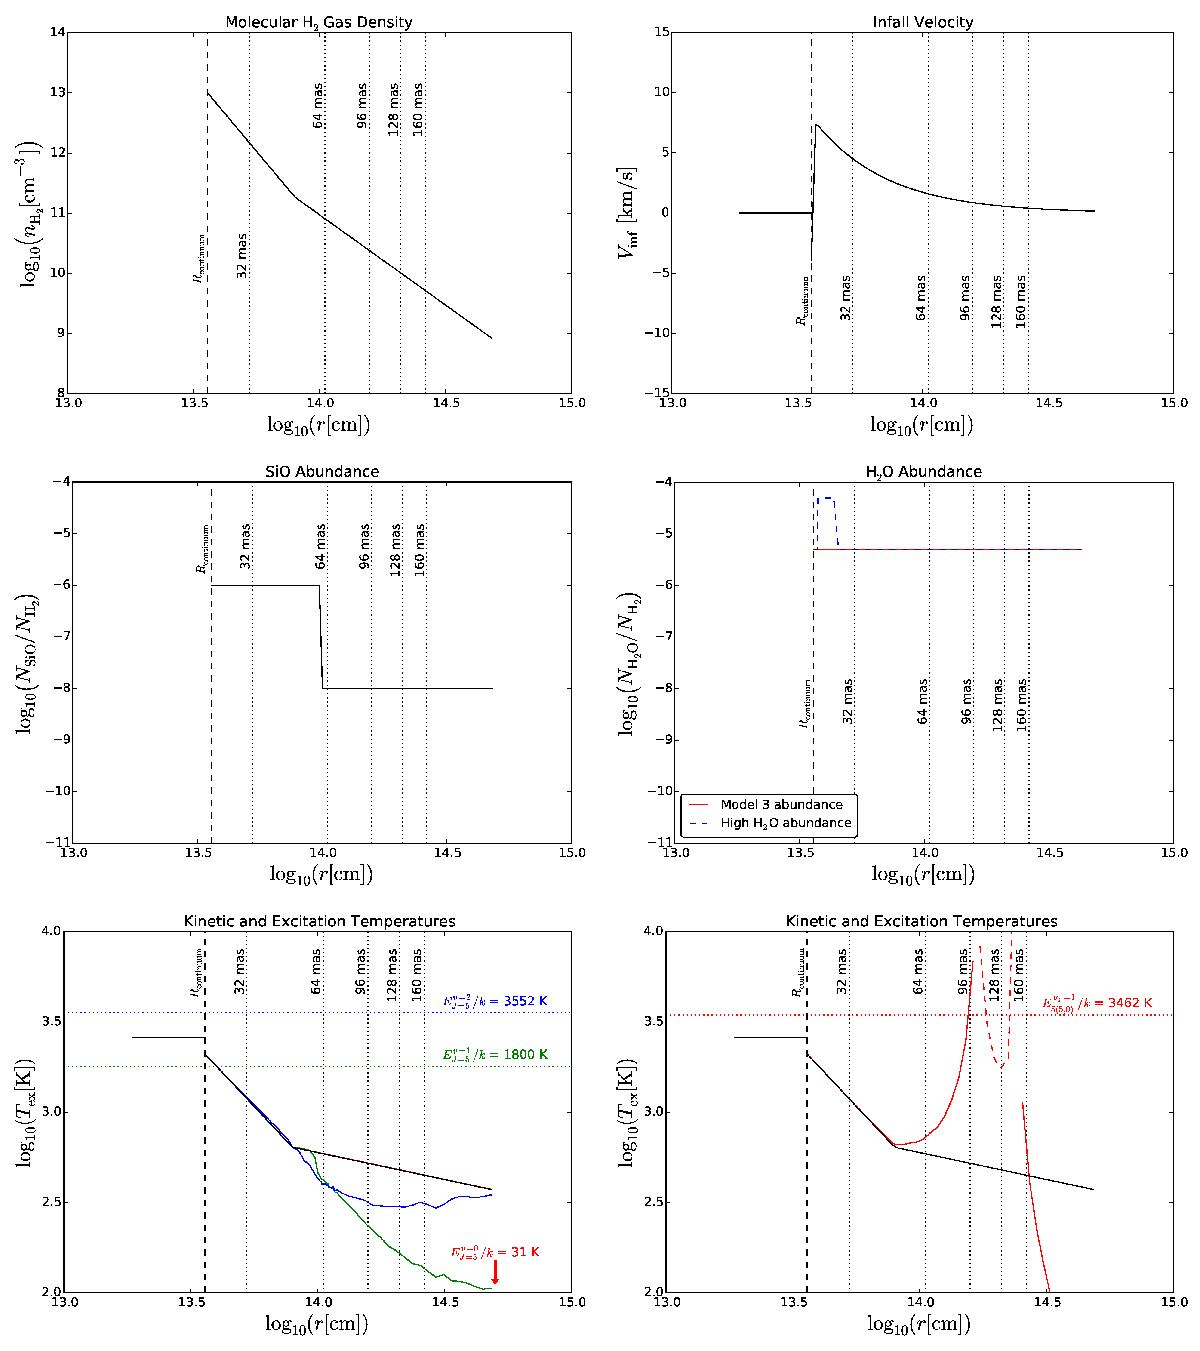
Inputs of our preferred model. Shown in the panels are the H2 gas density (top left), infall velocity (negative represents expansion; top right), 28SiO abundance (middle left), H2O abundance (middle right), and the kinetic temperature (in black) and excitation temperatures (in colours) of the three 28SiO transitions (bottom left) and the H2O transition (bottom right). In the bottom right panel, the solid red line indicates positive excitation temperature (i.e. non-maser emission) of the H2O transition, and the dashed red line indicates the absolute values of the negative excitation temperature (i.e. population inversion) between 1.7 × 10¹⁴ and 2.4 × 1014 cm. Small negative values for the excitation temperature would give strong maser emission. Vertical dotted lines indicate the radii where the spectra were extracted; coloured horizontal dotted lines in the bottom panels indicates the upper-state energy (Eup/k) of the respective transitions. The innermost layer within Rcontinuum represents the grid cells for the pseudo-continuum, whose input values for H2 gas density and molecular abundances are above the range of the plots.
Current usage metrics show cumulative count of Article Views (full-text article views including HTML views, PDF and ePub downloads, according to the available data) and Abstracts Views on Vision4Press platform.
Data correspond to usage on the plateform after 2015. The current usage metrics is available 48-96 hours after online publication and is updated daily on week days.
Initial download of the metrics may take a while.