Fig. 6
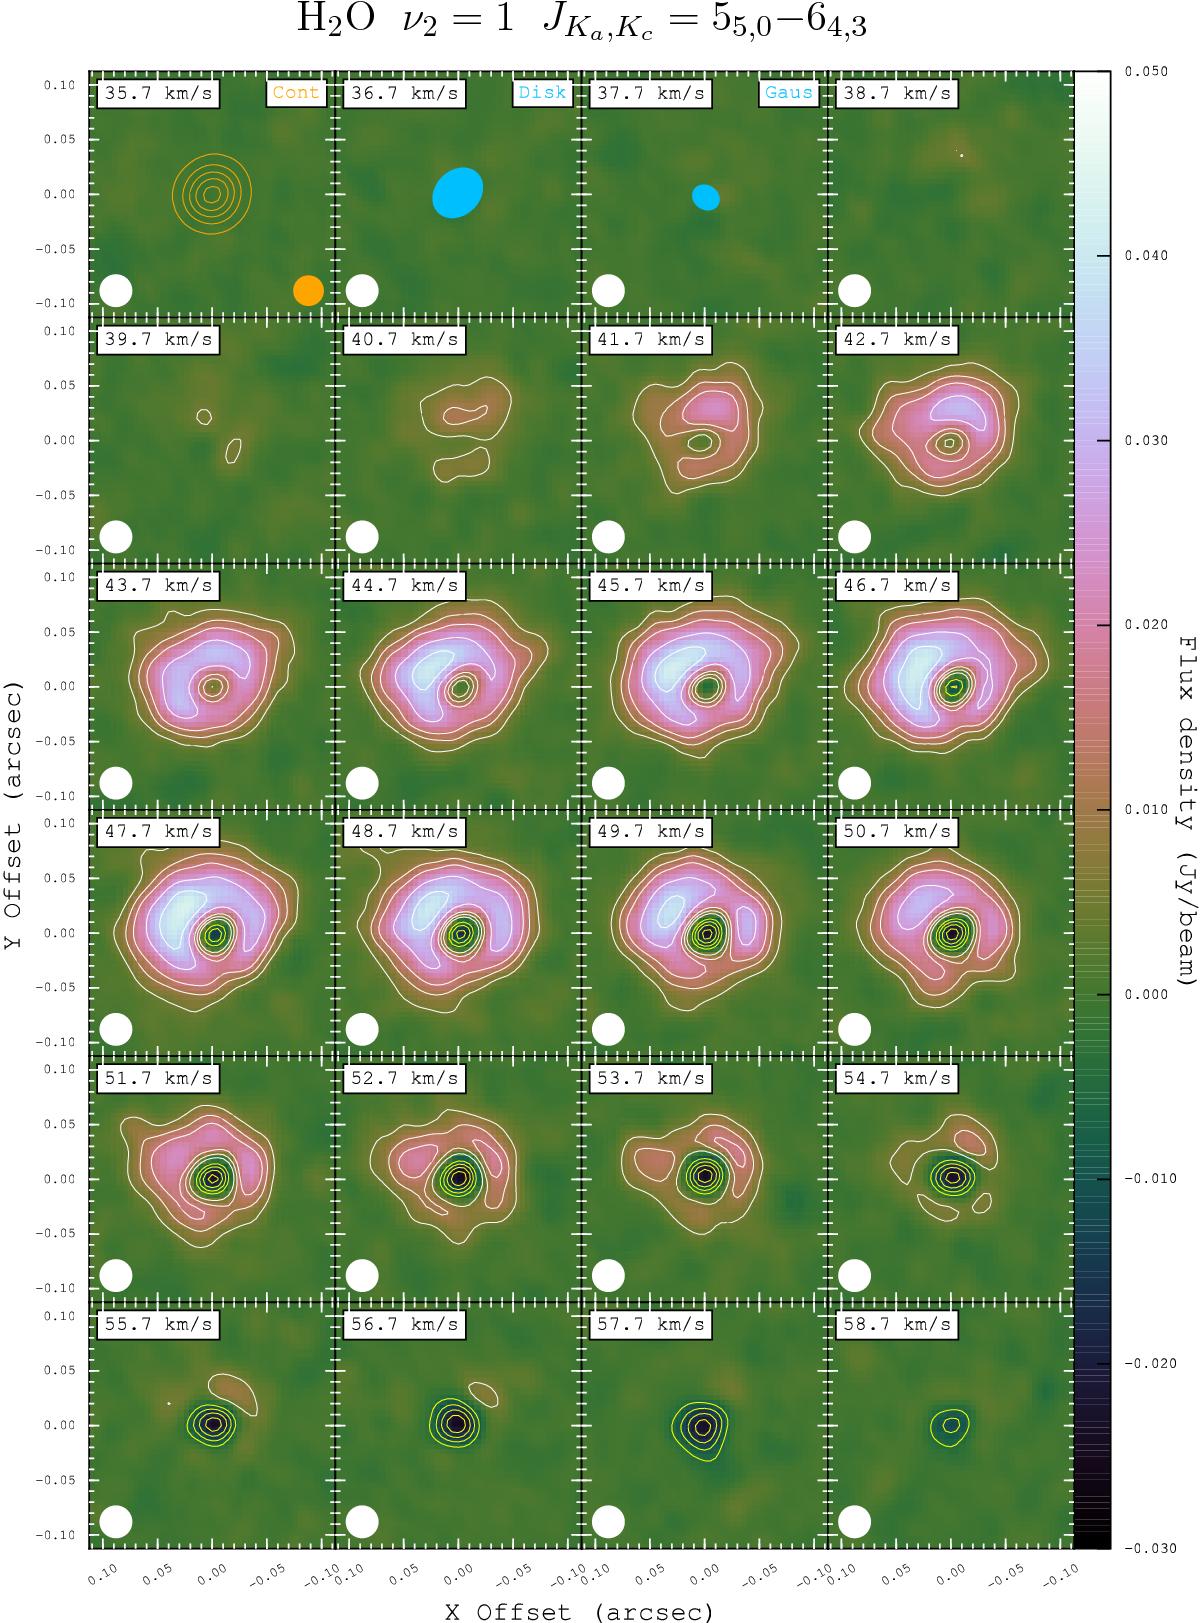
Same as Fig. 2 for the zoomed (![]() ) channel maps of post-imaging continuum-subtracted H2O v2 = 1JKa,Kc = 55,0−64,3. The white contours represent 6, 12, 18, 30, and 42σ and yellow contours represent −24, −18, −12, and −6σ, where σ = 0.85 mJy beam-1 is the map rms noise. The circular restoring beam of
) channel maps of post-imaging continuum-subtracted H2O v2 = 1JKa,Kc = 55,0−64,3. The white contours represent 6, 12, 18, 30, and 42σ and yellow contours represent −24, −18, −12, and −6σ, where σ = 0.85 mJy beam-1 is the map rms noise. The circular restoring beam of ![]() FWHM for the H2O images is indicated in white in the bottom left corner of each panel.
FWHM for the H2O images is indicated in white in the bottom left corner of each panel.
Current usage metrics show cumulative count of Article Views (full-text article views including HTML views, PDF and ePub downloads, according to the available data) and Abstracts Views on Vision4Press platform.
Data correspond to usage on the plateform after 2015. The current usage metrics is available 48-96 hours after online publication and is updated daily on week days.
Initial download of the metrics may take a while.