Fig. E.8
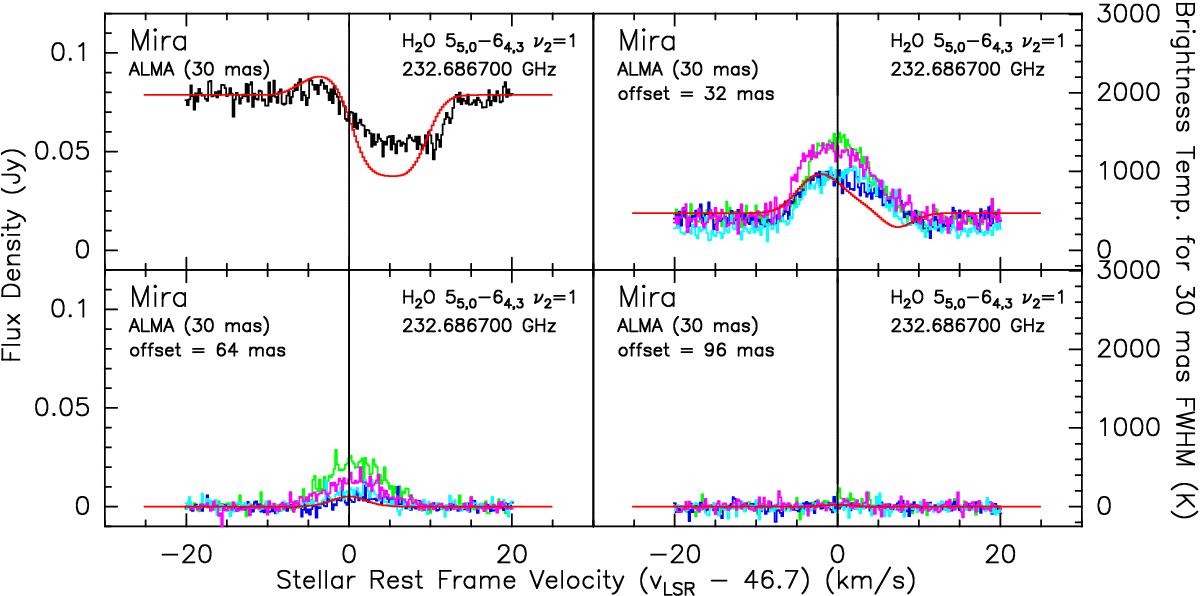
Model 2: spectra of H2O v2 = 1JKa,Kc = 55,0−64,3 at various positions. The black histogram is the observed spectrum at the centre of continuum; the green, blue, cyan, and magenta histograms are the observed spectra along the eastern, southern, western, and northern legs, respectively, at various offset radial distances as indicated in each panel. The red curves are the modelled spectra predicted by ratran.
Current usage metrics show cumulative count of Article Views (full-text article views including HTML views, PDF and ePub downloads, according to the available data) and Abstracts Views on Vision4Press platform.
Data correspond to usage on the plateform after 2015. The current usage metrics is available 48-96 hours after online publication and is updated daily on week days.
Initial download of the metrics may take a while.