Fig. C.1
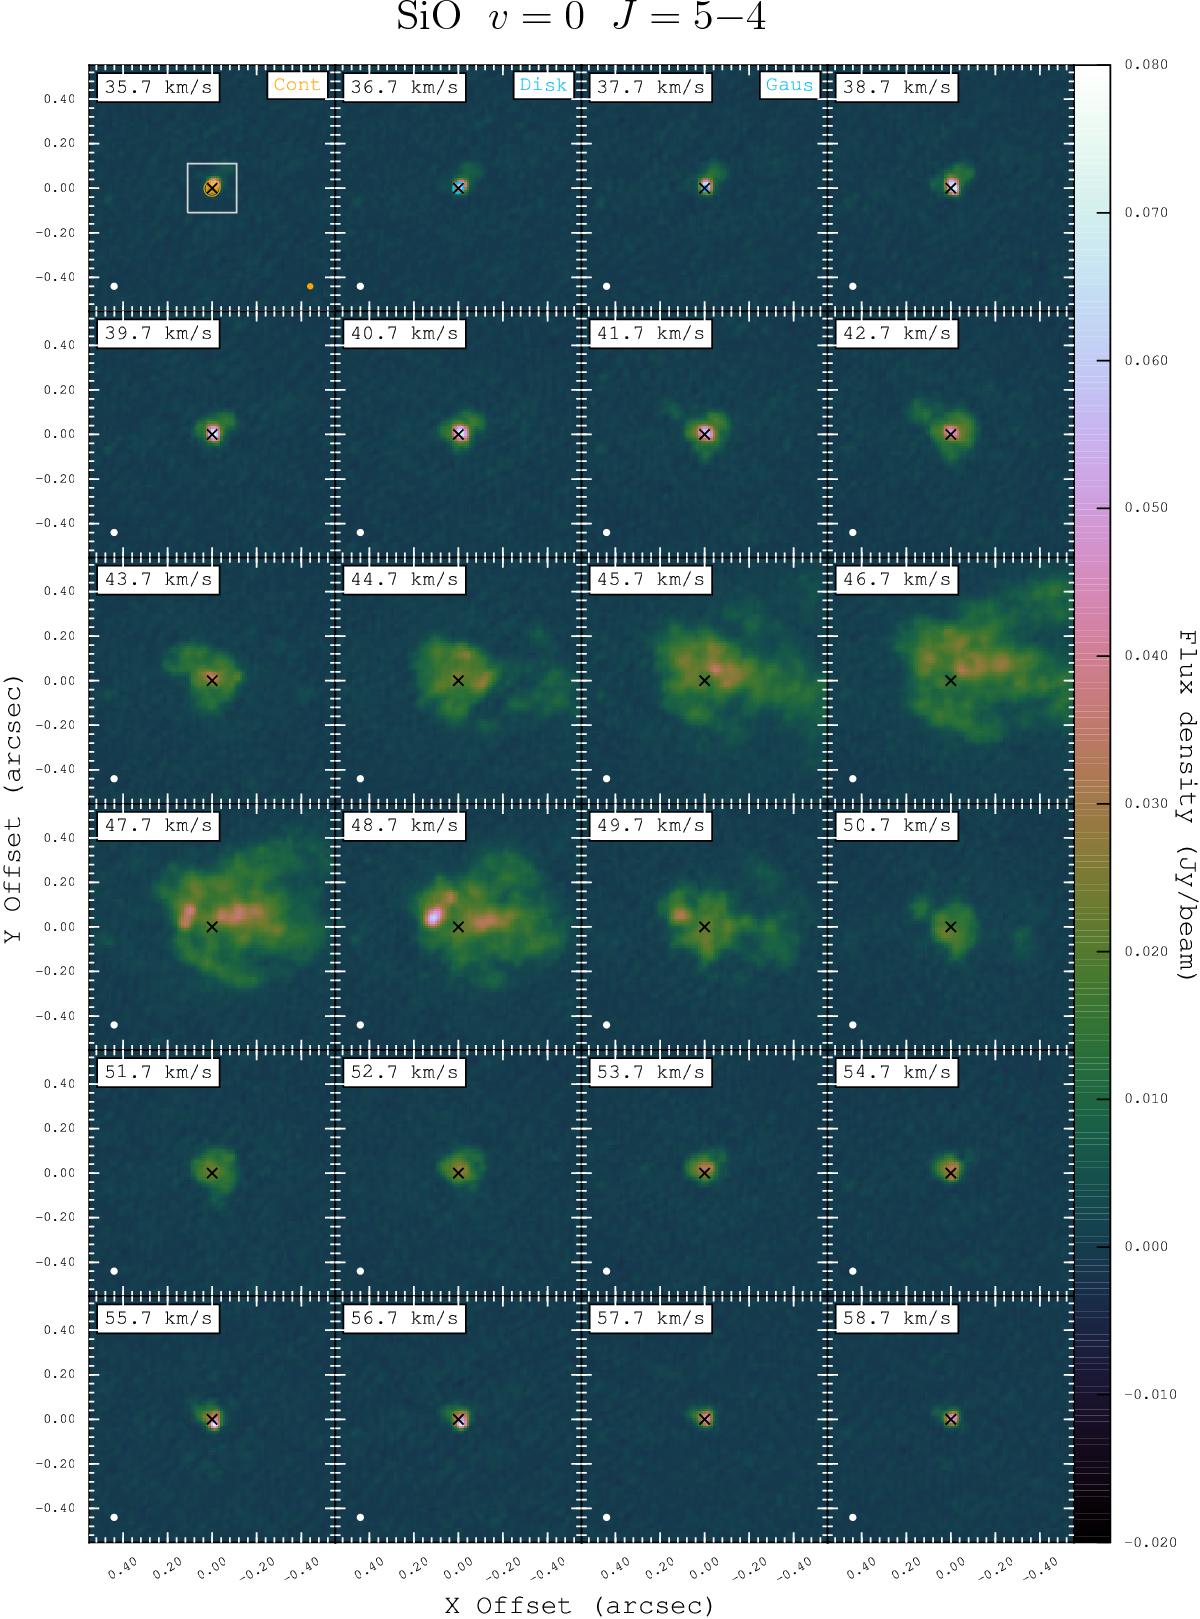
Same as Fig. 2 for the channel maps, including continuum emission from Mira A, of SiO ν= 0J = 5−4. The absolute position of Mira A is denoted by a black cross. The map rms noise is 0.80 mJy beam-1. In the first panel of the top row, the white box centred at Mira A indicates the ![]() region of the zoomed maps of SiO ν= 0 (Fig. C.2), ν= 2 (Fig. C.4), and H2O v2 = 1 (Fig. C.5).
region of the zoomed maps of SiO ν= 0 (Fig. C.2), ν= 2 (Fig. C.4), and H2O v2 = 1 (Fig. C.5).
Current usage metrics show cumulative count of Article Views (full-text article views including HTML views, PDF and ePub downloads, according to the available data) and Abstracts Views on Vision4Press platform.
Data correspond to usage on the plateform after 2015. The current usage metrics is available 48-96 hours after online publication and is updated daily on week days.
Initial download of the metrics may take a while.