Fig. B.5
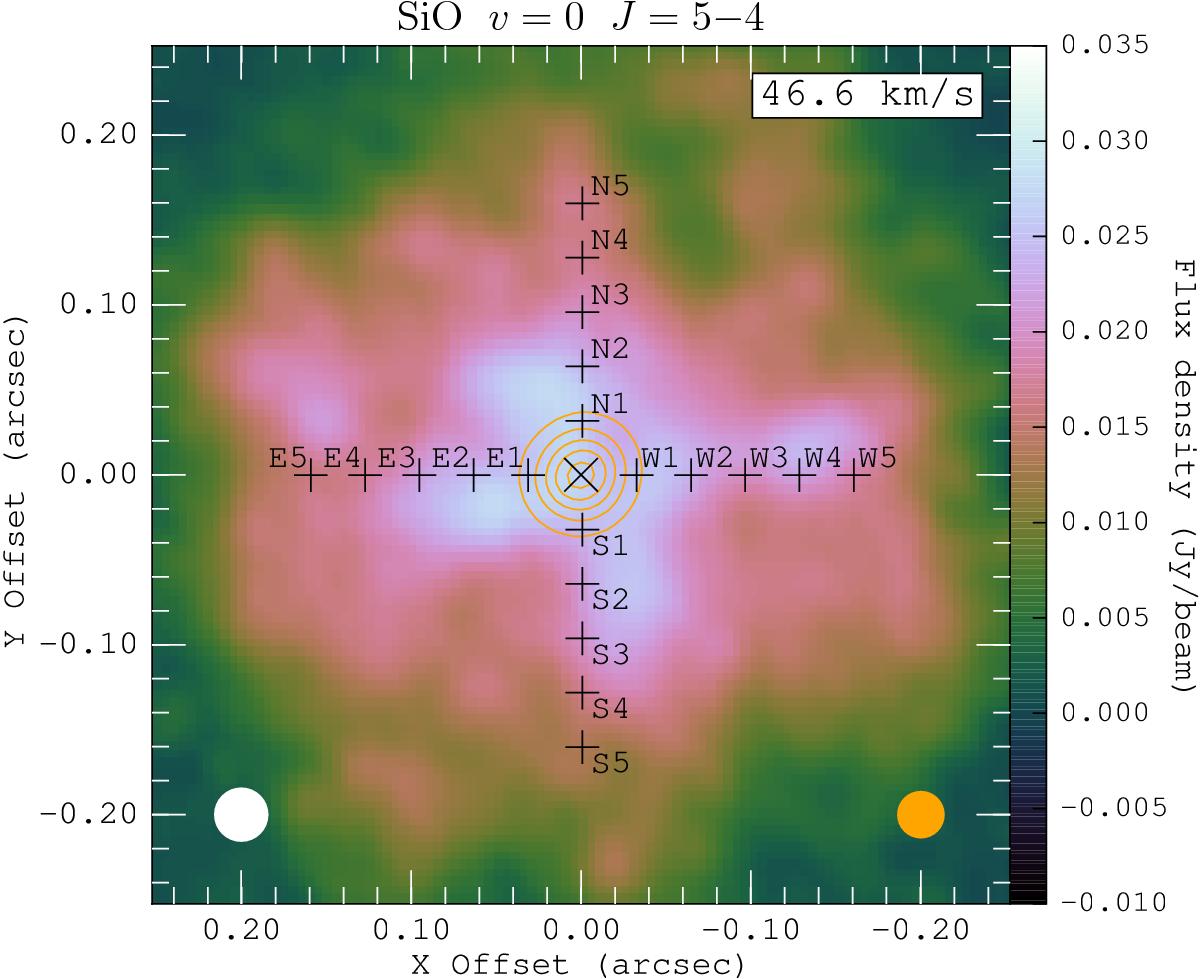
Same as Fig. 7 for the simulated map of SiO ν= 0J = 5−4 (with the continuum) at the channel of velocity 46.6 km s-1 with a channel width of 1 km s-1. The velocity is slightly different from the systemic velocity of 46.7 km s-1 because of the different velocity grid in our model. The orange contours represent the real data of Mira’s radio continuum at 229 GHz.
Current usage metrics show cumulative count of Article Views (full-text article views including HTML views, PDF and ePub downloads, according to the available data) and Abstracts Views on Vision4Press platform.
Data correspond to usage on the plateform after 2015. The current usage metrics is available 48-96 hours after online publication and is updated daily on week days.
Initial download of the metrics may take a while.