Fig. B.4
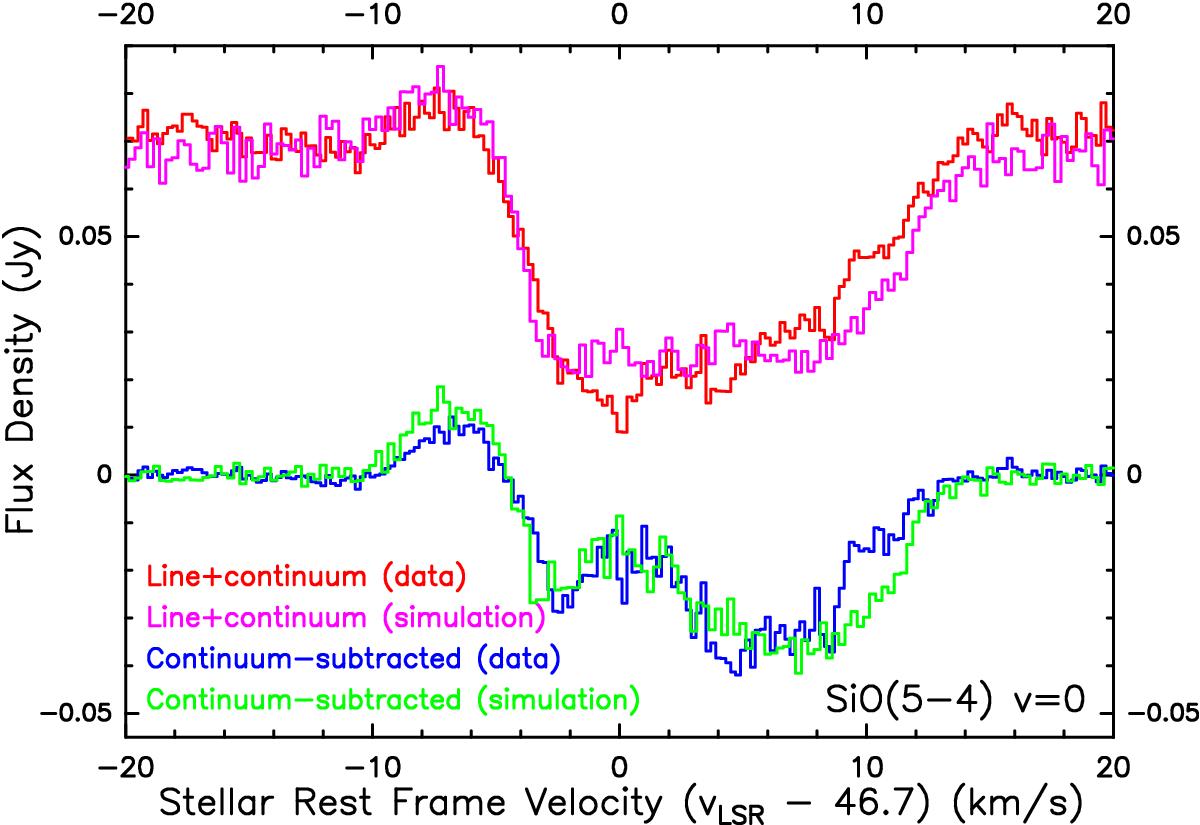
28SiO ν= 0J = 5−4 spectra extracted from the line of sight towards the centre of Mira’s continuum from the full data images (line+continuum; red and magenta at the top) and from the continuum-subtracted images (blue and green at the bottom). The red and blue spectra correspond to the images from the actual data of Mira’s ALMA SV observation, and the magenta and green spectra correspond to the simulated data using CASA task simobserve. The imaging procedures for the observed and simulated data are identical.
Current usage metrics show cumulative count of Article Views (full-text article views including HTML views, PDF and ePub downloads, according to the available data) and Abstracts Views on Vision4Press platform.
Data correspond to usage on the plateform after 2015. The current usage metrics is available 48-96 hours after online publication and is updated daily on week days.
Initial download of the metrics may take a while.