Free Access
Fig. B.3
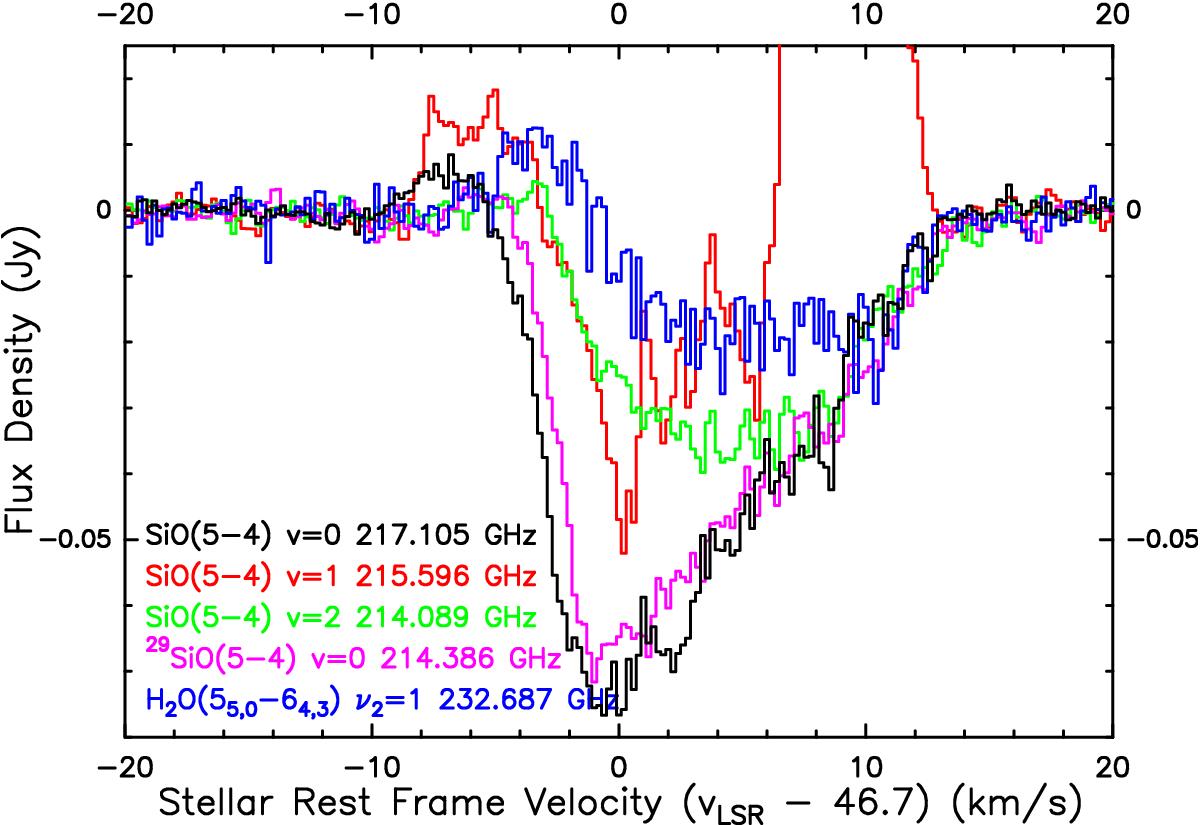
Spectral lines in ALMA Band 6 extracted from the line of sight towards the centre of Mira’s continuum from the continuum-subtracted maps, only imaged with baselines longer than 500 m. The maser emission from SiO ν= 1J = 5−4 transition (in red) above 0.025 Jy is not shown in this figure.
Current usage metrics show cumulative count of Article Views (full-text article views including HTML views, PDF and ePub downloads, according to the available data) and Abstracts Views on Vision4Press platform.
Data correspond to usage on the plateform after 2015. The current usage metrics is available 48-96 hours after online publication and is updated daily on week days.
Initial download of the metrics may take a while.