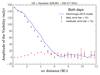
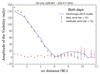
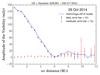
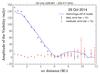
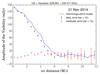
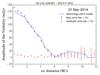
Fig. A.3

Visibility plots of the continuum fitting with the task uvfit in Miriad using the parameters obtained by Vlemmings et al. (2015). All the plots are the results of the continuum window at 229.6 GHz. The top panels are the results without splitting the datasets into individual days. The middle and bottom panels are the results of split data for 2014 October 29 and 2014 November 01, respectively. The three panels on the left are the results using uniform disk and a Gaussian to fit Mira A, and the three on the right are the results using only a uniform disk for Mira A. The error bars in the continuum window and spectral line windows are 10 times and 1 time, respectively, the standard deviation in the mean of the amplitude of visibilities in the respective bin of uv-distance. The large error bar near 10 Mλ is due to the small number of data points.
Current usage metrics show cumulative count of Article Views (full-text article views including HTML views, PDF and ePub downloads, according to the available data) and Abstracts Views on Vision4Press platform.
Data correspond to usage on the plateform after 2015. The current usage metrics is available 48-96 hours after online publication and is updated daily on week days.
Initial download of the metrics may take a while.