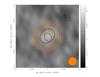
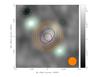
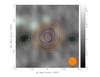
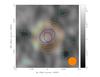
Fig. A.2
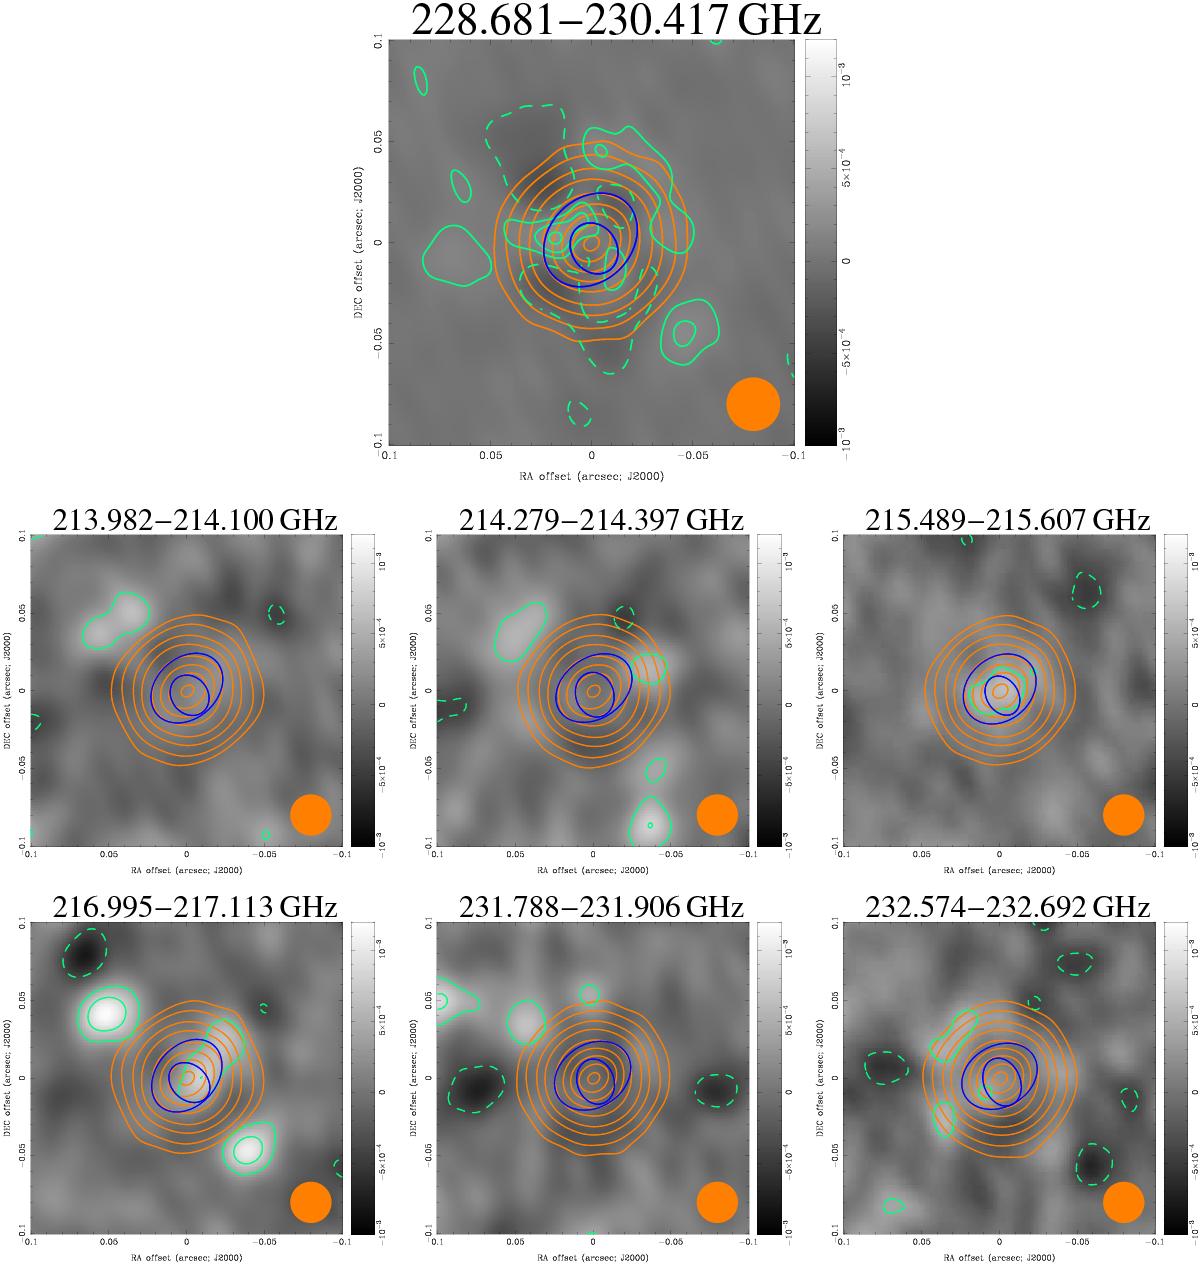
Continuum fitting results with the task uvfit in Miriad. The large map on the top is the continuum window at 229.6 GHz, the six smaller maps below are (from top to bottom, and from left to right) the spectral line windows in ascending order of frequency: 214.0 GHz, 214.3 GHz, 215.5 GHz, 271.1 GHz, 231.8 GHz, and 231.6 GHz as listed in Table A.1. In all the panels, the orange contours are the continuum models for Mira A, with parameters listed in Table A.1. The sizes of the uniform disk and Gaussian models for the respective spectral windows are shown by blue open ellipses (larger and smaller, respectively). The continuum contour levels are −3,3,10,30,60,120,180,240,300,340 × 0.20 mJy. The green contours and the greyscale maps are the residual images (difference between the data and modelled continuum) of the respective spectral windows. The residual contour levels are −2,2,4,6 × σ, where σ = 0.04 mJy for the continuum window (top) and σ = 0.20 mJy for the six line windows (bottom two rows). The restoring beam of ![]() FWHM is indicated in orange in the bottom right corner in each panel.
FWHM is indicated in orange in the bottom right corner in each panel.
Current usage metrics show cumulative count of Article Views (full-text article views including HTML views, PDF and ePub downloads, according to the available data) and Abstracts Views on Vision4Press platform.
Data correspond to usage on the plateform after 2015. The current usage metrics is available 48-96 hours after online publication and is updated daily on week days.
Initial download of the metrics may take a while.