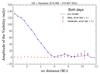
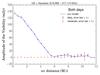
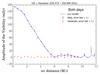
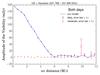
Fig. A.1
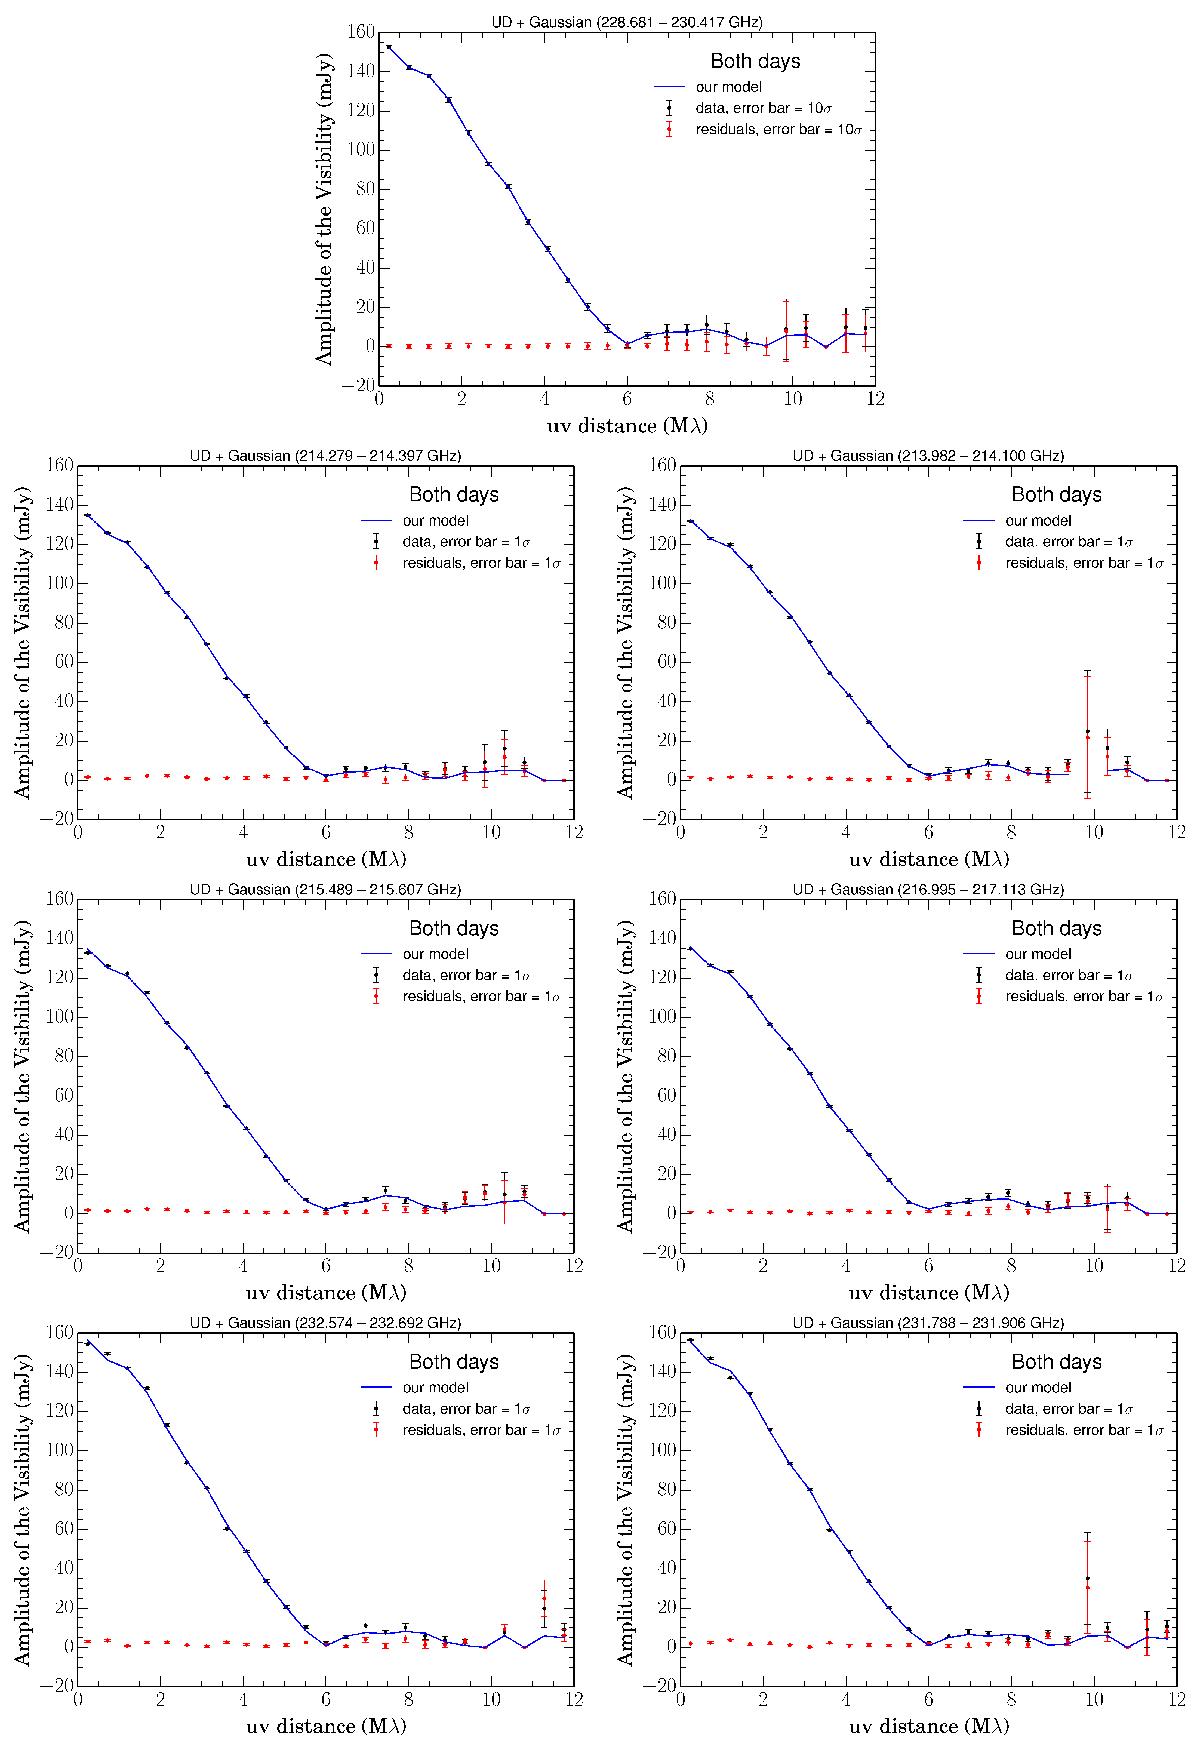
Visibility plots of the continuum fitting with the task uvfit in Miriad. The plot on the top is the continuum window at 229.6 GHz, and the six below are (from top to bottom, and from left to right) the spectral line windows in ascending order of frequency: 214.0 GHz, 214.3 GHz, 215.5 GHz, 271.1 GHz, 231.8 GHz, 231.6 GHz as listed in Table A.1. The error bars in the continuum window and spectral line windows are 10 times and 1 time, respectively, the standard deviation in the mean of the amplitude of visibilities in the respective bin of uv-distance. The large error bar near 10 Mλ is due to the small number of data points.
Current usage metrics show cumulative count of Article Views (full-text article views including HTML views, PDF and ePub downloads, according to the available data) and Abstracts Views on Vision4Press platform.
Data correspond to usage on the plateform after 2015. The current usage metrics is available 48-96 hours after online publication and is updated daily on week days.
Initial download of the metrics may take a while.