Fig. 17
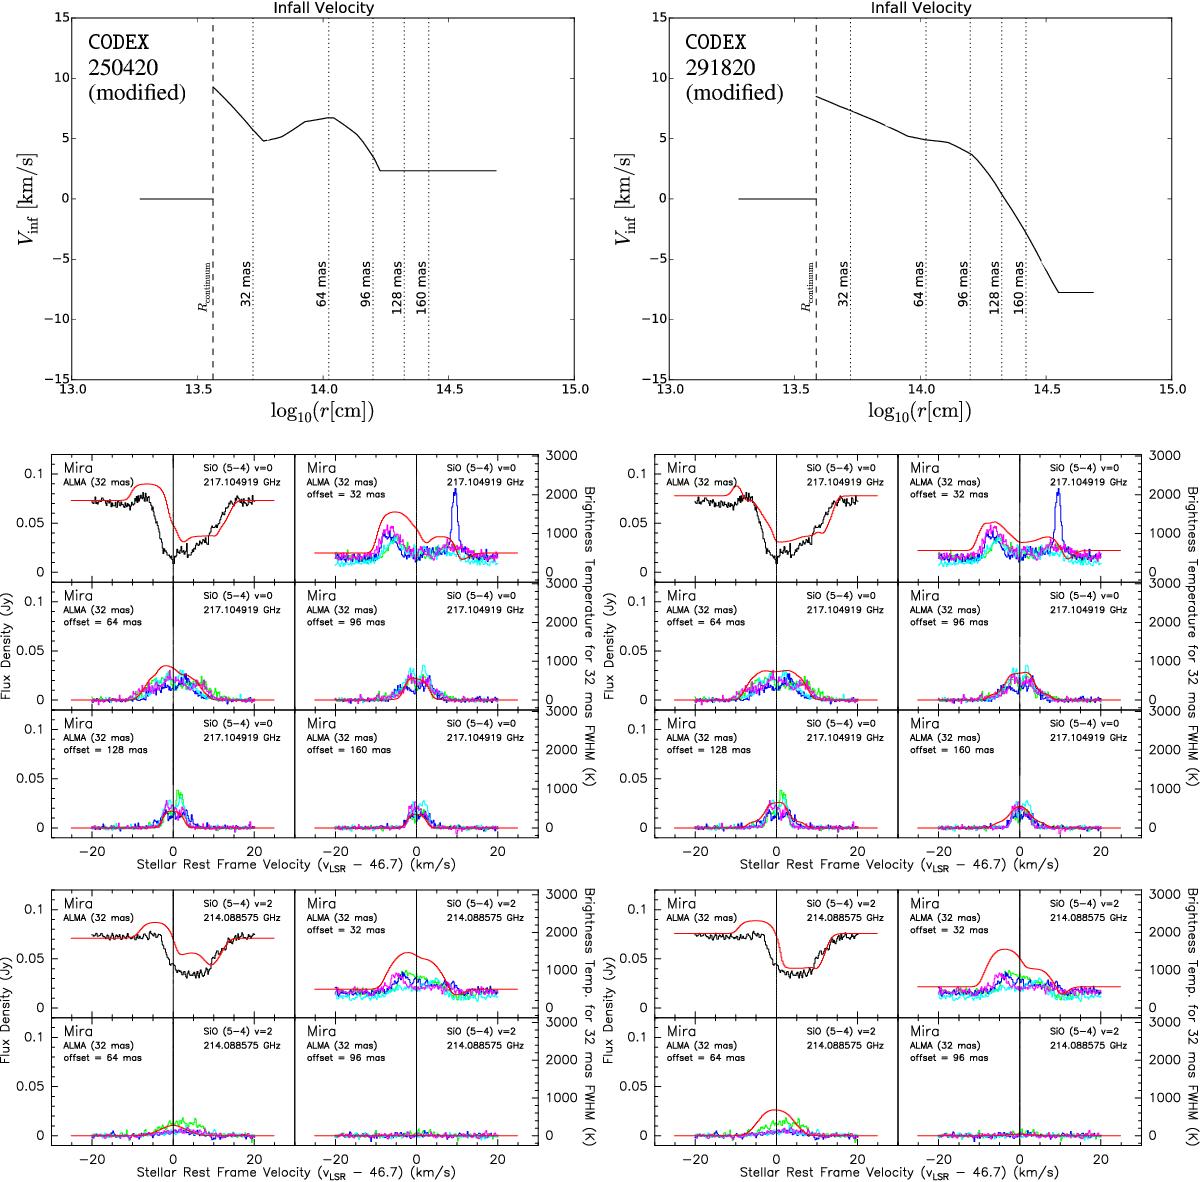
Similar to Fig. 16, except that the radius of the pseudo-continuum in the model, Rcontinuum, is changed to 3.65 × 1013 cm for model 250420 (left column) and 3.85 × 1013 cm for model 291820 (right column). The modelled continuum levels are therefore slightly higher than those adopting Rcontinuum = 3.60 × 1013 cm. The strong shock fronts predicted in these two models are hidden inside the radio continuum. The middle and bottom rows show the selected resultant SiO spectra from the corresponding models.
Current usage metrics show cumulative count of Article Views (full-text article views including HTML views, PDF and ePub downloads, according to the available data) and Abstracts Views on Vision4Press platform.
Data correspond to usage on the plateform after 2015. The current usage metrics is available 48-96 hours after online publication and is updated daily on week days.
Initial download of the metrics may take a while.