Fig. 15
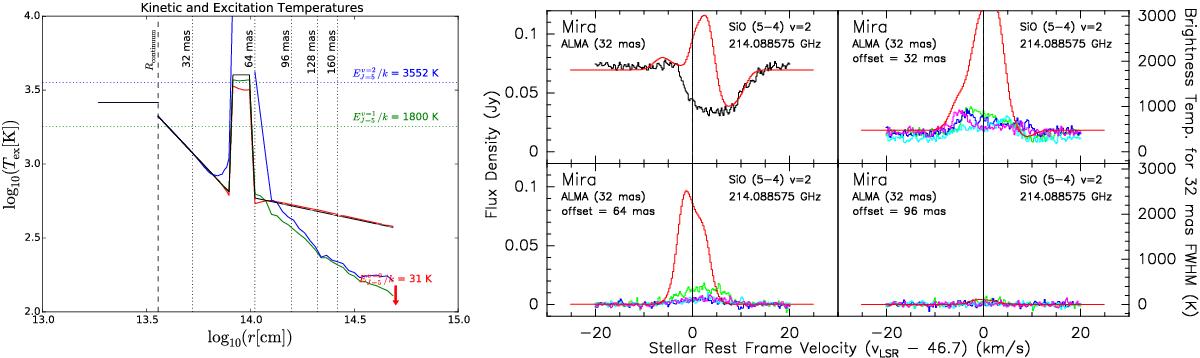
Preferred model with a layer of an elevated gas temperature. The layer has a width of 2.0 × 1013 cm and an arbitrarily chosen temperature of 4000 K. The left panel shows the elevated gas temperature profiles and the right panel shows the observed and modelled SiO ν= 2J = 5−4 spectra as examples. All other parameters are the same as our preferred model (Model 3).
Current usage metrics show cumulative count of Article Views (full-text article views including HTML views, PDF and ePub downloads, according to the available data) and Abstracts Views on Vision4Press platform.
Data correspond to usage on the plateform after 2015. The current usage metrics is available 48-96 hours after online publication and is updated daily on week days.
Initial download of the metrics may take a while.