Fig. 14
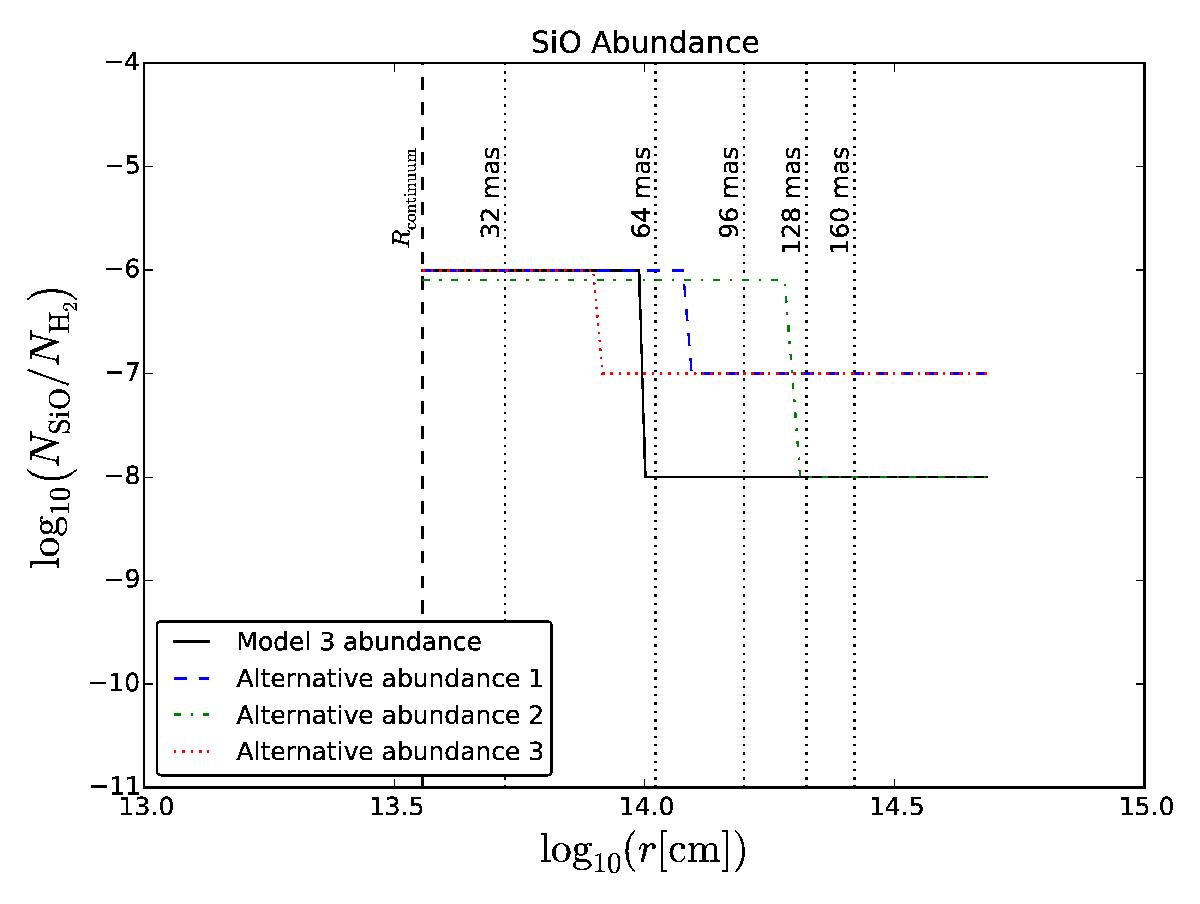
Alternative input 28SiO abundance profiles for Model 3 which produce similar modelled spectra. The solid black curve is the same two-step abundance profile as in Model 3, which is close to the minimum possible abundance to fit the ALMA spectra. The three other coloured curves are alternative abundance profiles also using two-step functions. Abundance profile 1 (blue, dashed) has an inner abundance of 1 × 10⁻⁶ up to the radius of ~6 R⋆ and an outer abundance of 1 × 10⁻⁷; profile 2 (green, dash-dotted) has an inner abundance of 8 × 10⁻⁷ up to ~10 R⋆ and an outer abundance of 1 × 10⁻⁸; and profile 3 (red, dotted) has an inner abundance of 1 × 10⁻⁶ up to ~4 R⋆ and an outer abundance of 1 × 10⁻⁷.
Current usage metrics show cumulative count of Article Views (full-text article views including HTML views, PDF and ePub downloads, according to the available data) and Abstracts Views on Vision4Press platform.
Data correspond to usage on the plateform after 2015. The current usage metrics is available 48-96 hours after online publication and is updated daily on week days.
Initial download of the metrics may take a while.