Fig. 1
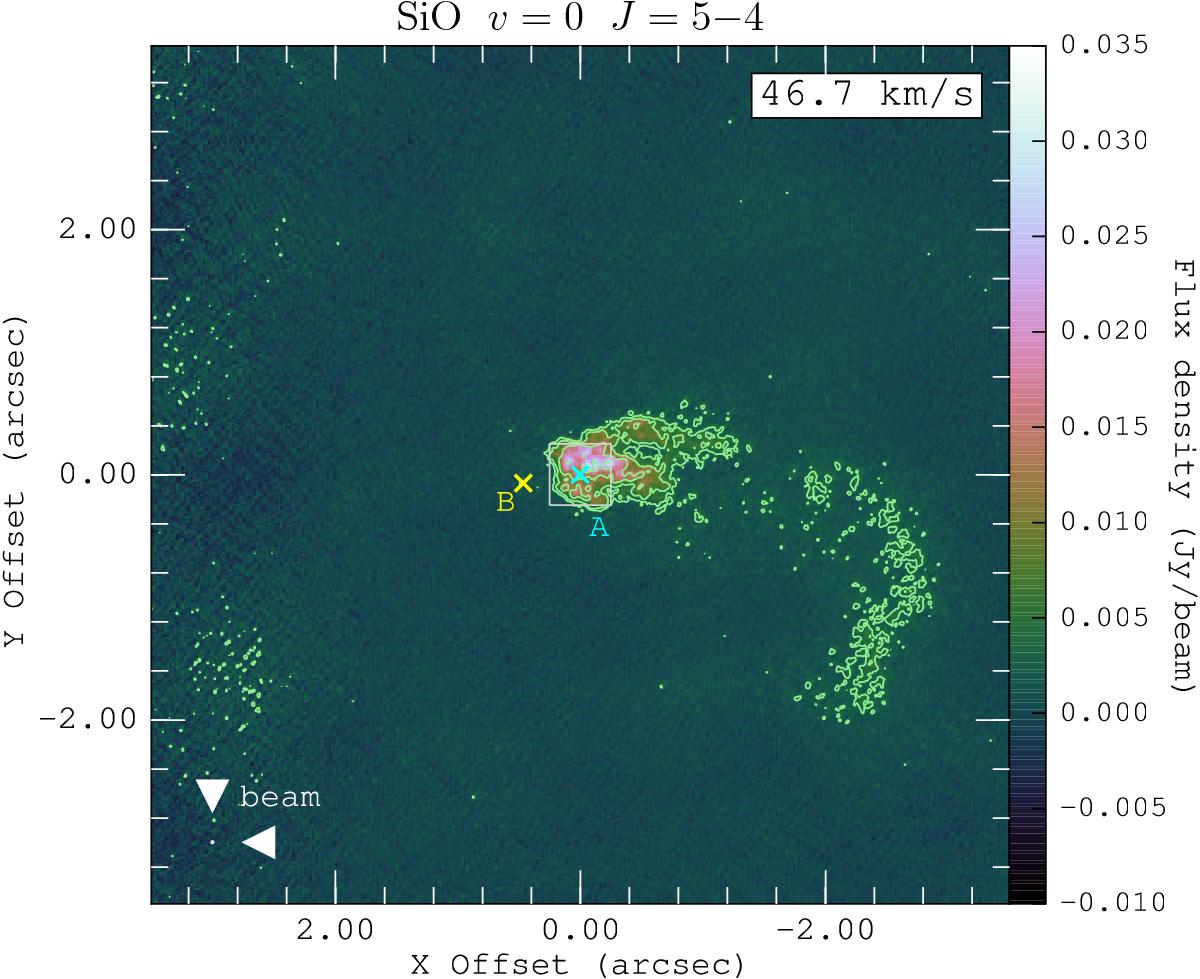
Map of SiO ν= 0J = 5−4 (with the continuum) at the channel of the systemic velocity (46.7 km s-1) with a channel width of 1.0 km s-1. The positions of Mira A (o Ceti; cyan cross) and Mira B (VZ Ceti; yellow cross) are indicated in the image. The horizontal and vertical axes are the relative offsets (arcsec) in the directions of right ascension (X) and declination (Y), respectively, with respect to the continuum centre of Mira A. The white box centred at the fitted position of Mira A indicates the ![]() region as shown in Fig. 7, within which we extract the SiO and H2O line spectra from an array of positions. The horizontal and vertical axes are the relative offsets (arcsec) with respect to the Mira A in right ascension and declination, respectively. The light green contours represent 4, 8, 16, and 32σ of the SiO emission from the gas near Mira A, where the map rms noise is σ = 0.80 mJy beam-1. The circular restoring beam of
region as shown in Fig. 7, within which we extract the SiO and H2O line spectra from an array of positions. The horizontal and vertical axes are the relative offsets (arcsec) with respect to the Mira A in right ascension and declination, respectively. The light green contours represent 4, 8, 16, and 32σ of the SiO emission from the gas near Mira A, where the map rms noise is σ = 0.80 mJy beam-1. The circular restoring beam of ![]() FWHM for the SiO image is indicated in white in the bottom left corner.
FWHM for the SiO image is indicated in white in the bottom left corner.
Current usage metrics show cumulative count of Article Views (full-text article views including HTML views, PDF and ePub downloads, according to the available data) and Abstracts Views on Vision4Press platform.
Data correspond to usage on the plateform after 2015. The current usage metrics is available 48-96 hours after online publication and is updated daily on week days.
Initial download of the metrics may take a while.