Free Access
Fig. 6
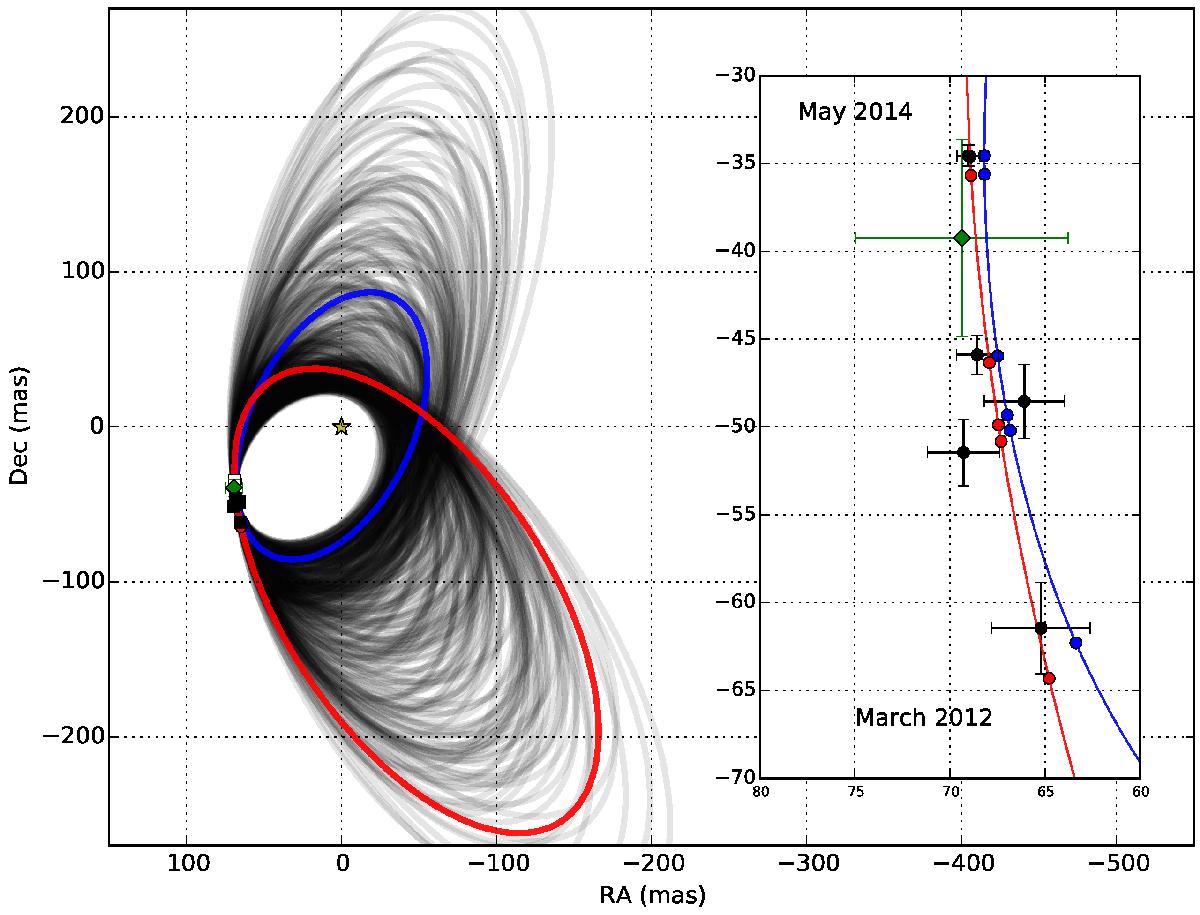
Likely orbits for HD 142527B from MCMC simulation. The red and blue curves correspond to maximum likelihood parameters. The gray curves indicate possible solutions from the MCMC computations. The SAM observation indicate black squares. The green lozenge corresponds to a MagAO observation reported by Rodigas et al. (2014).
Current usage metrics show cumulative count of Article Views (full-text article views including HTML views, PDF and ePub downloads, according to the available data) and Abstracts Views on Vision4Press platform.
Data correspond to usage on the plateform after 2015. The current usage metrics is available 48-96 hours after online publication and is updated daily on week days.
Initial download of the metrics may take a while.