Fig. 1
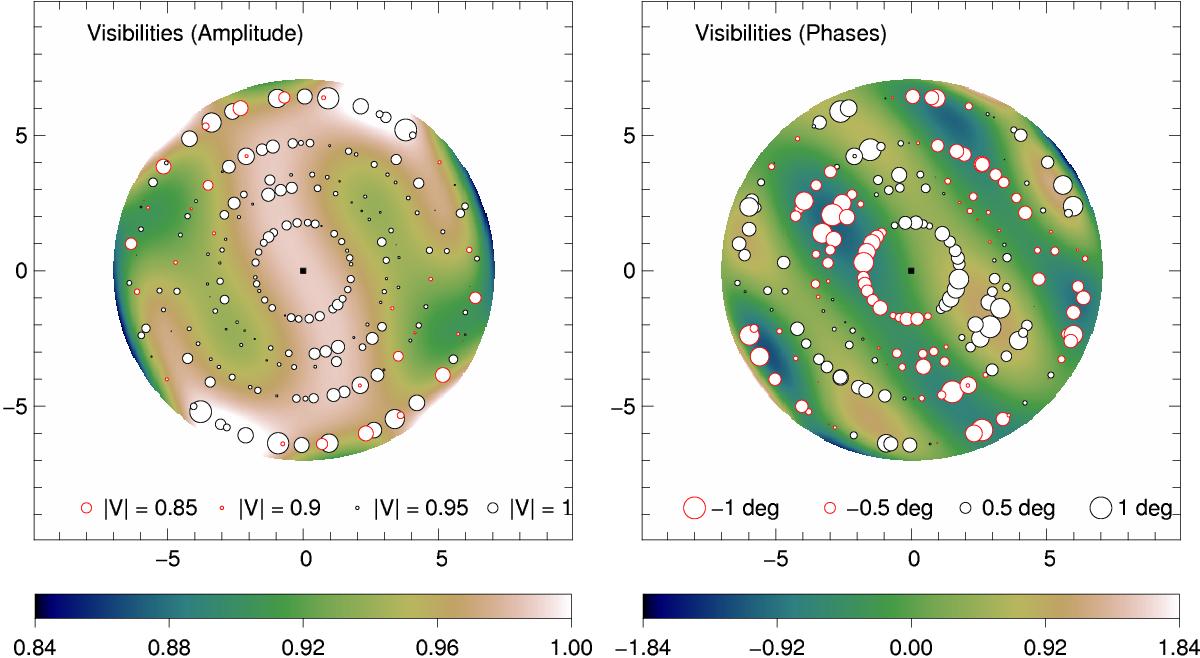
SAM K band dataset. The phase and amplitude in the Fourier domain are represented by the size and color of the open circles. The units are normalized visibility for the amplitudes (left panel) and degrees for the phases (right panel). The color continuum below the data point are obtained by fitting Zernike polynomials to the data. The diagonal stripes observed on the phases are typical of a binary system.
Current usage metrics show cumulative count of Article Views (full-text article views including HTML views, PDF and ePub downloads, according to the available data) and Abstracts Views on Vision4Press platform.
Data correspond to usage on the plateform after 2015. The current usage metrics is available 48-96 hours after online publication and is updated daily on week days.
Initial download of the metrics may take a while.