Fig. 9
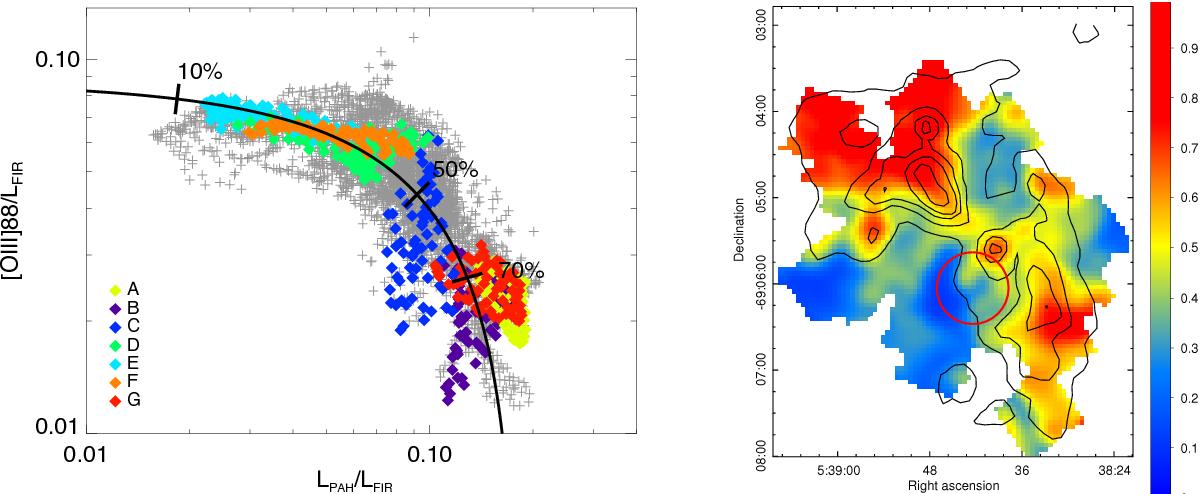
Left: ratio [O iii] 88 μm/LFIR as a function of LPAH/LFIR. The color symbols are associated with the regions defined in Fig. 3. The gray symbols denote all of the other pixels of our 30Dor map. The solid curve shows the result of the multiple linear regression, using the values α = 5.4 and β = 11.5. The values indicate the fraction of LFIR coming from the PDR for three different positions on the curve. Right: ratio of ![]() /LFIR. Black contours represent the total FIR emission. Close to the location of R136, only 20 to 30% of the LFIR come from the PDRs.
/LFIR. Black contours represent the total FIR emission. Close to the location of R136, only 20 to 30% of the LFIR come from the PDRs.
Current usage metrics show cumulative count of Article Views (full-text article views including HTML views, PDF and ePub downloads, according to the available data) and Abstracts Views on Vision4Press platform.
Data correspond to usage on the plateform after 2015. The current usage metrics is available 48-96 hours after online publication and is updated daily on week days.
Initial download of the metrics may take a while.