Fig. 5
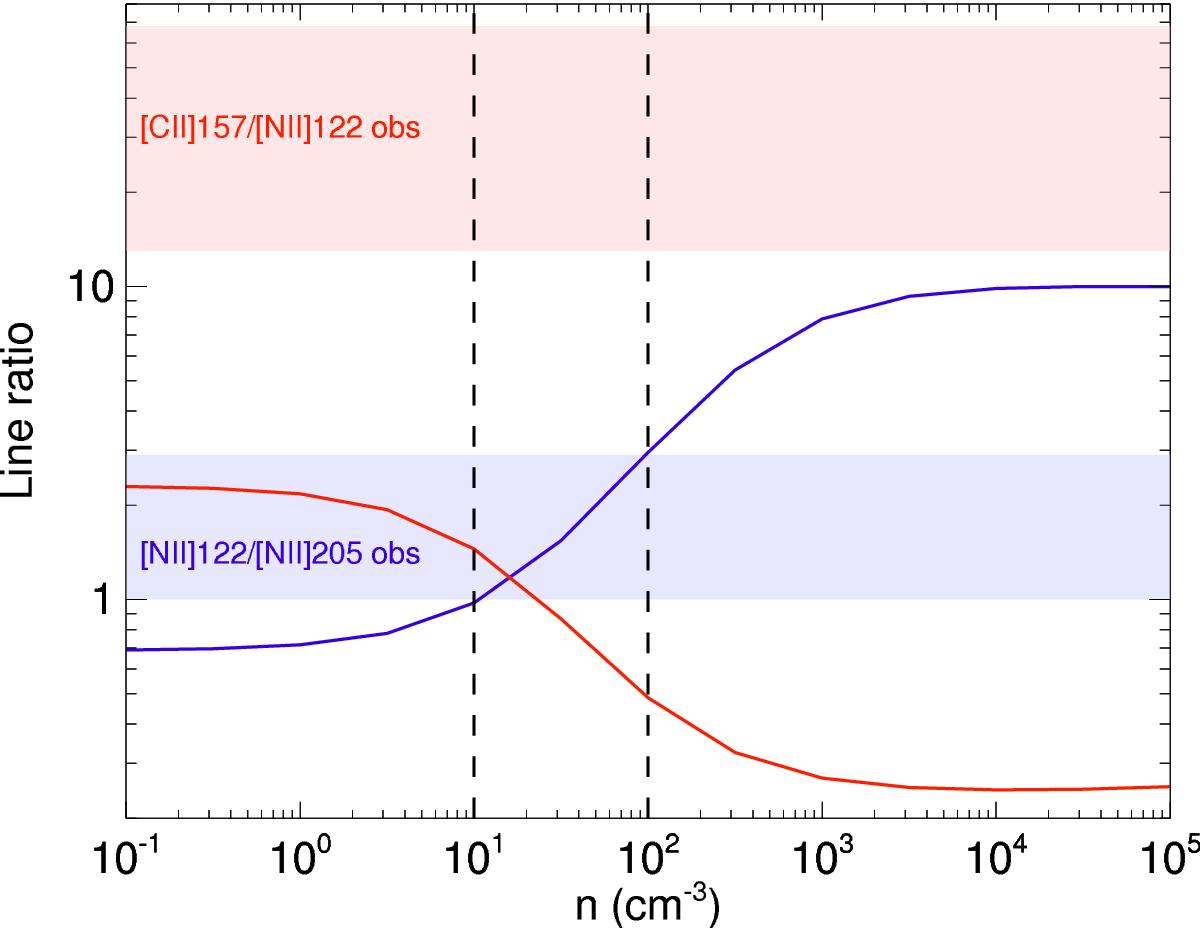
Theoretical ratios [N ii] 122 μm/[N ii] 205 μm (blue) and [C ii]/[N ii] 122 μm (red) at the temperature of 10 000 K. Blue and red areas indicate our observed ranges for [N ii] 122 μm/[N ii] 205 μm and [C ii]/[N ii] 122 μm ratios, respectively. The observed values of the [C ii]/[N ii] ratio (in red) are much higher than the theoretical value in the ionized gas for the entire map, indicating that [C ii] is mostly emitted in the PDRs and not in the ionized gas.
Current usage metrics show cumulative count of Article Views (full-text article views including HTML views, PDF and ePub downloads, according to the available data) and Abstracts Views on Vision4Press platform.
Data correspond to usage on the plateform after 2015. The current usage metrics is available 48-96 hours after online publication and is updated daily on week days.
Initial download of the metrics may take a while.