Free Access
Fig. 4
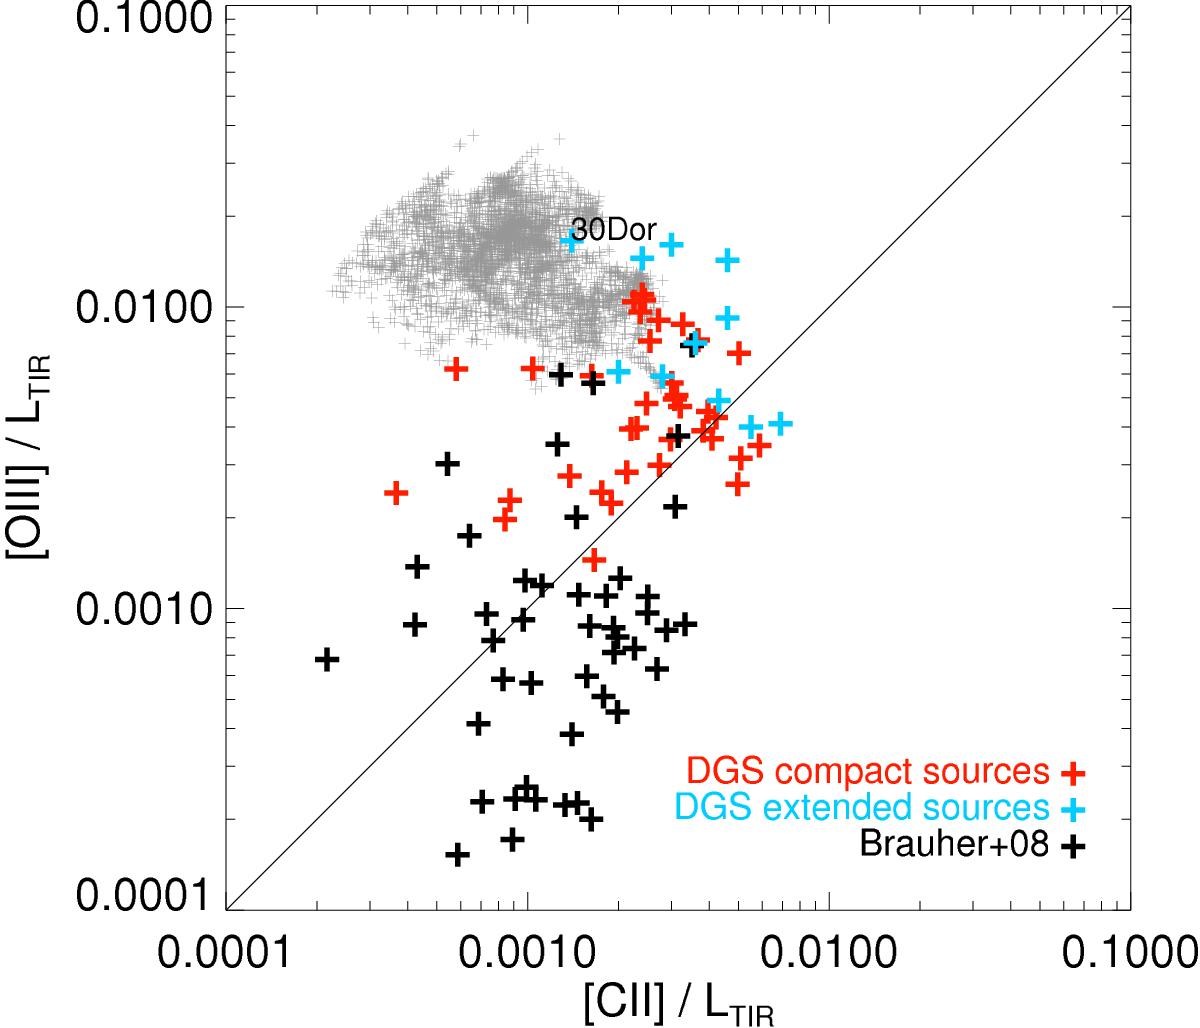
[O iii]/LTIRversus [C ii]/LTIR. The regions in 30Dor form the gray cloud with the high [O iii]/LTIRvalues. The DGS galaxies (Cormier et al. 2015) are represented by red (compact) and cyan (extended) symbols. The (mostly) metal-rich galaxies from Brauher et al. (2008) are represented by black symbols.
Current usage metrics show cumulative count of Article Views (full-text article views including HTML views, PDF and ePub downloads, according to the available data) and Abstracts Views on Vision4Press platform.
Data correspond to usage on the plateform after 2015. The current usage metrics is available 48-96 hours after online publication and is updated daily on week days.
Initial download of the metrics may take a while.