Fig. 3
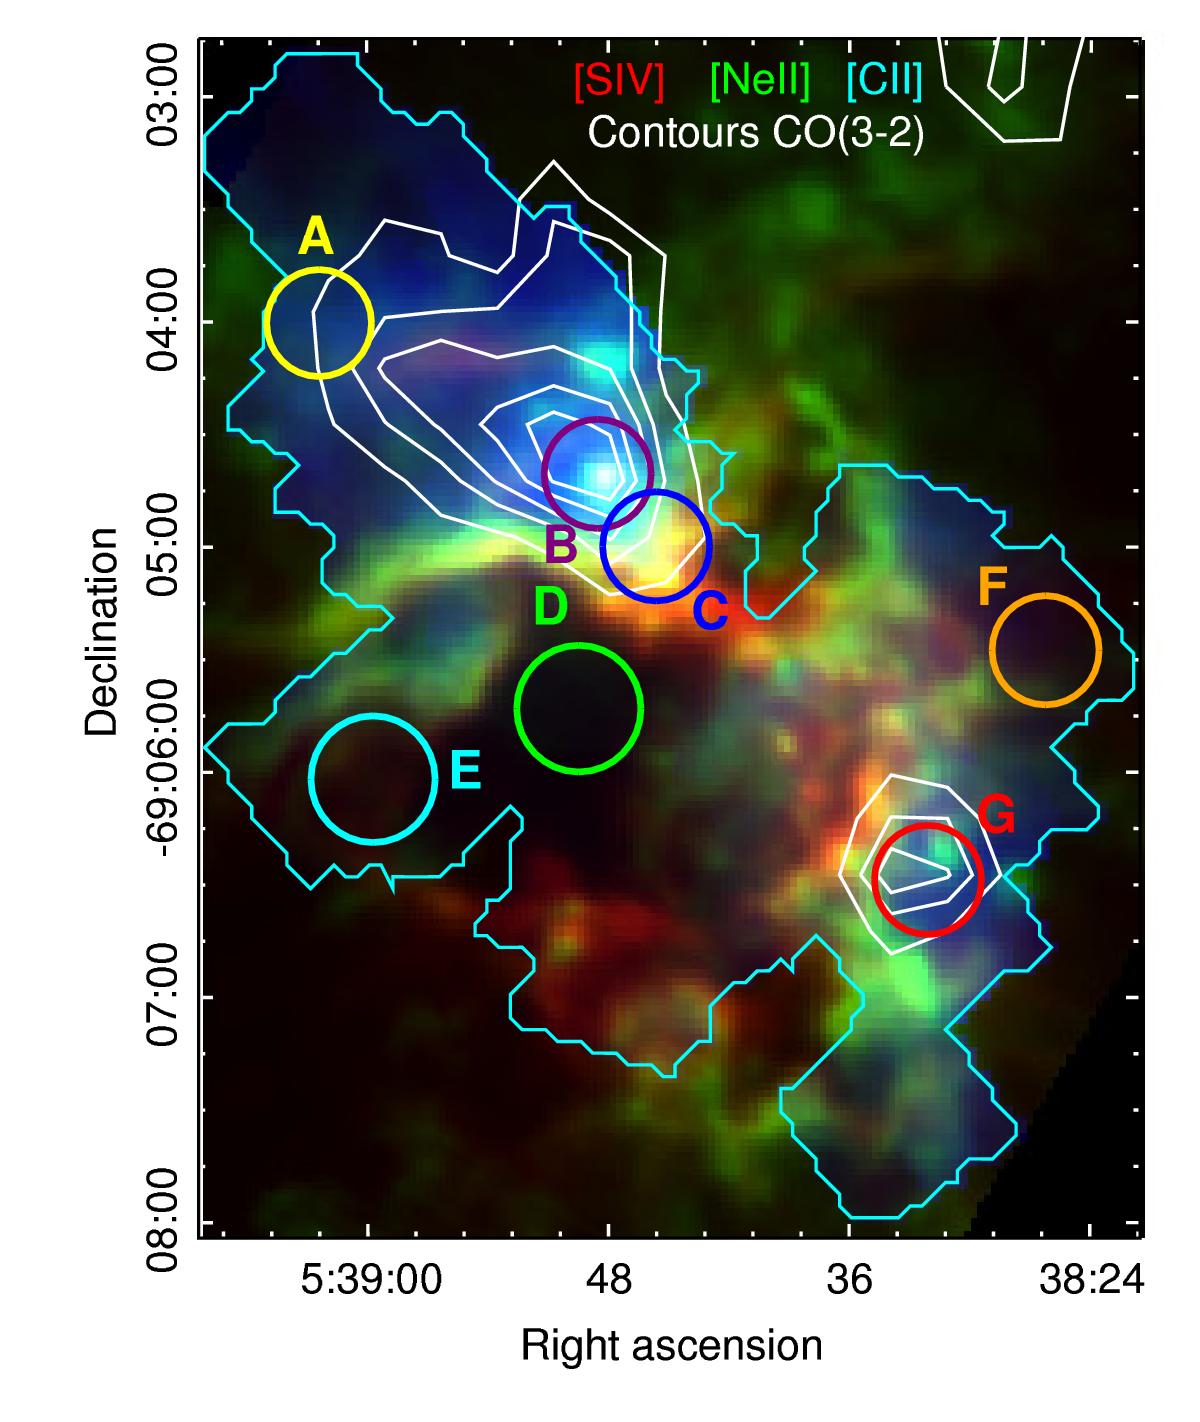
Red: Spitzer/IRS [S iv] 10.5 μm (Indebetouw et al. 2009). Green: Spitzer/IRS [Ne ii] 12.8 μm (Indebetouw et al. 2009). Blue: PACS [C ii] 158 μm. The blue contours outline the limit of the [C ii] map. We can identify the different layers of the gas from the highly ionized medium near the star cluster R136 to the clumpy molecular gas. The contours of the 12CO(3–2) emission observed with ASTE (Minamidani et al. 2011) are indicated in white. The yellow region (A) is located on the northeast of R136, where [C ii] is extended but where [O iii] seems fainter. The violet circle (B) is located on the [C ii] peak, and the blue circle (C) is on the [O iii] peak. The green (D), cyan (E), and orange (F) circles probe more diffuse regions. The southwest peak of [C ii] is in the red region (G).
Current usage metrics show cumulative count of Article Views (full-text article views including HTML views, PDF and ePub downloads, according to the available data) and Abstracts Views on Vision4Press platform.
Data correspond to usage on the plateform after 2015. The current usage metrics is available 48-96 hours after online publication and is updated daily on week days.
Initial download of the metrics may take a while.