Free Access
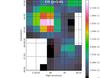
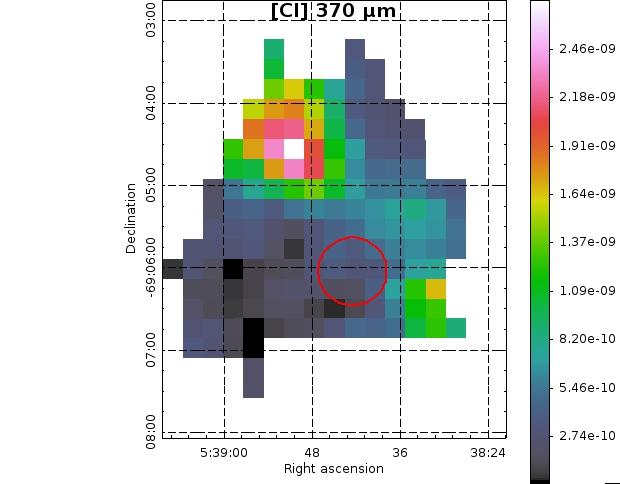
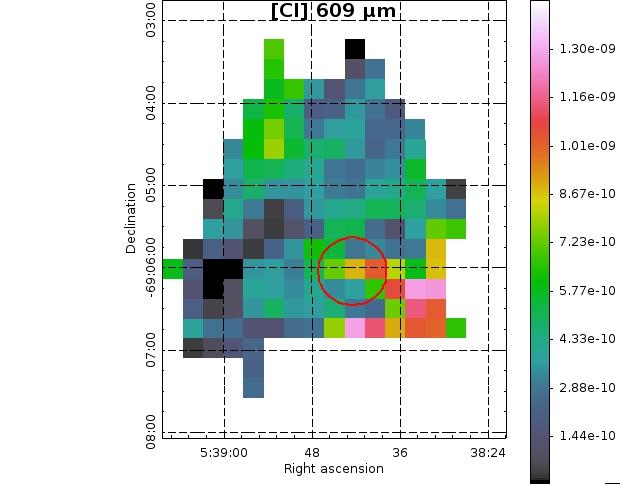
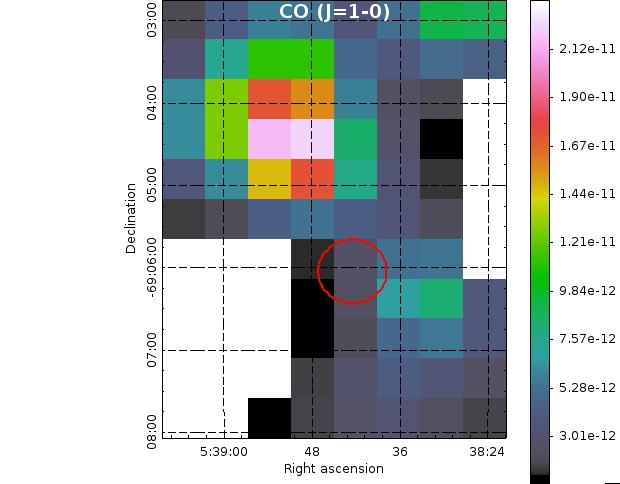
Fig. 2
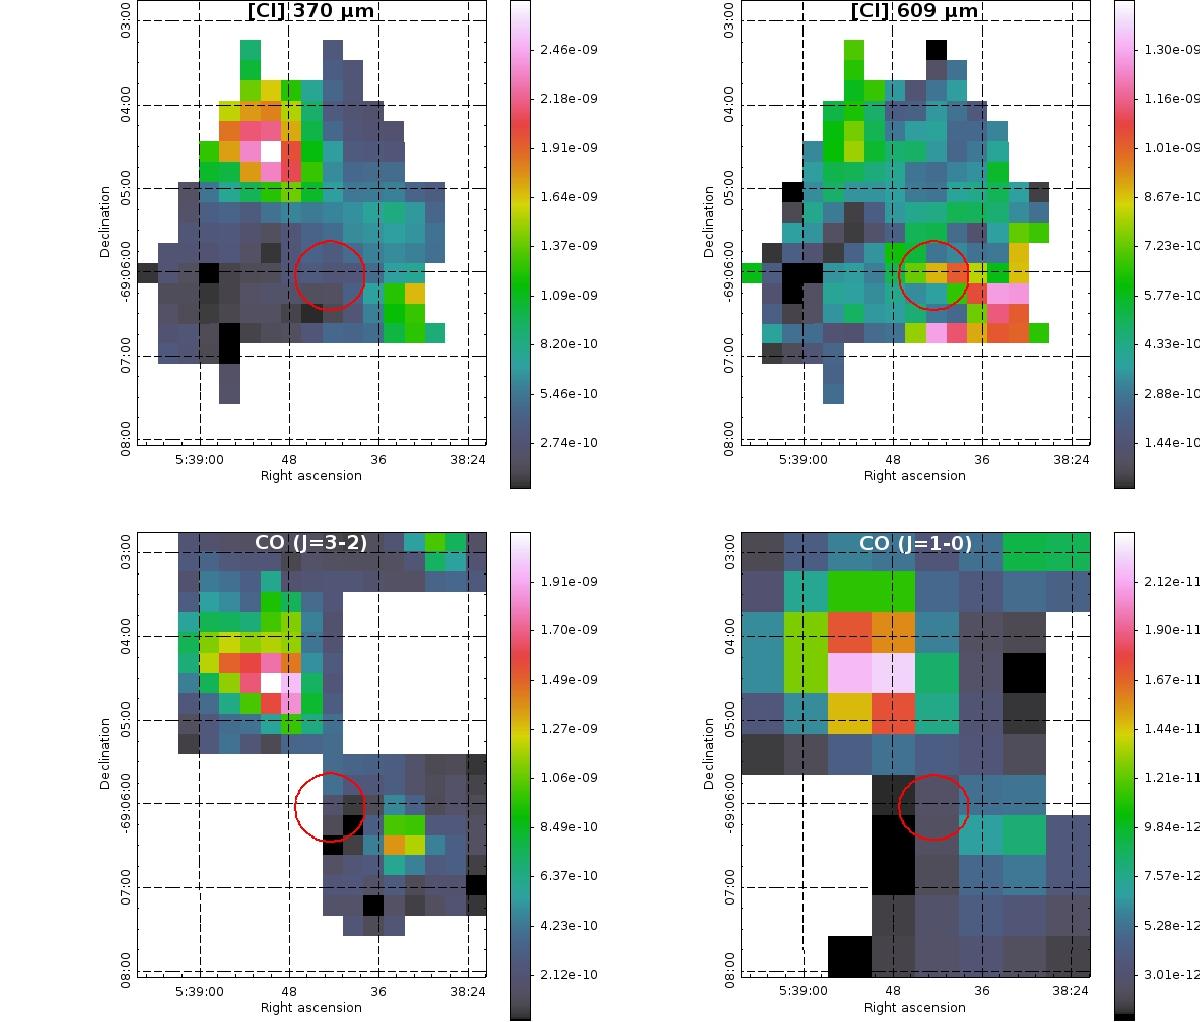
Top panels: [C i] 370 μm (left) and [C i] 609 μm (right) SPIRE/FTS maps of 30Dor. Bottom panels: CO (3–2) ASTE map (left) and CO (1–0) Mopra map (right). All of the maps are shown at their original resolution, in W m-2 sr-1. The circle shows the location of R136. Table 1 and Sect. 2 describe these observations in detail.
This figure is made of several images, please see below:
Current usage metrics show cumulative count of Article Views (full-text article views including HTML views, PDF and ePub downloads, according to the available data) and Abstracts Views on Vision4Press platform.
Data correspond to usage on the plateform after 2015. The current usage metrics is available 48-96 hours after online publication and is updated daily on week days.
Initial download of the metrics may take a while.