Free Access
Fig. 18
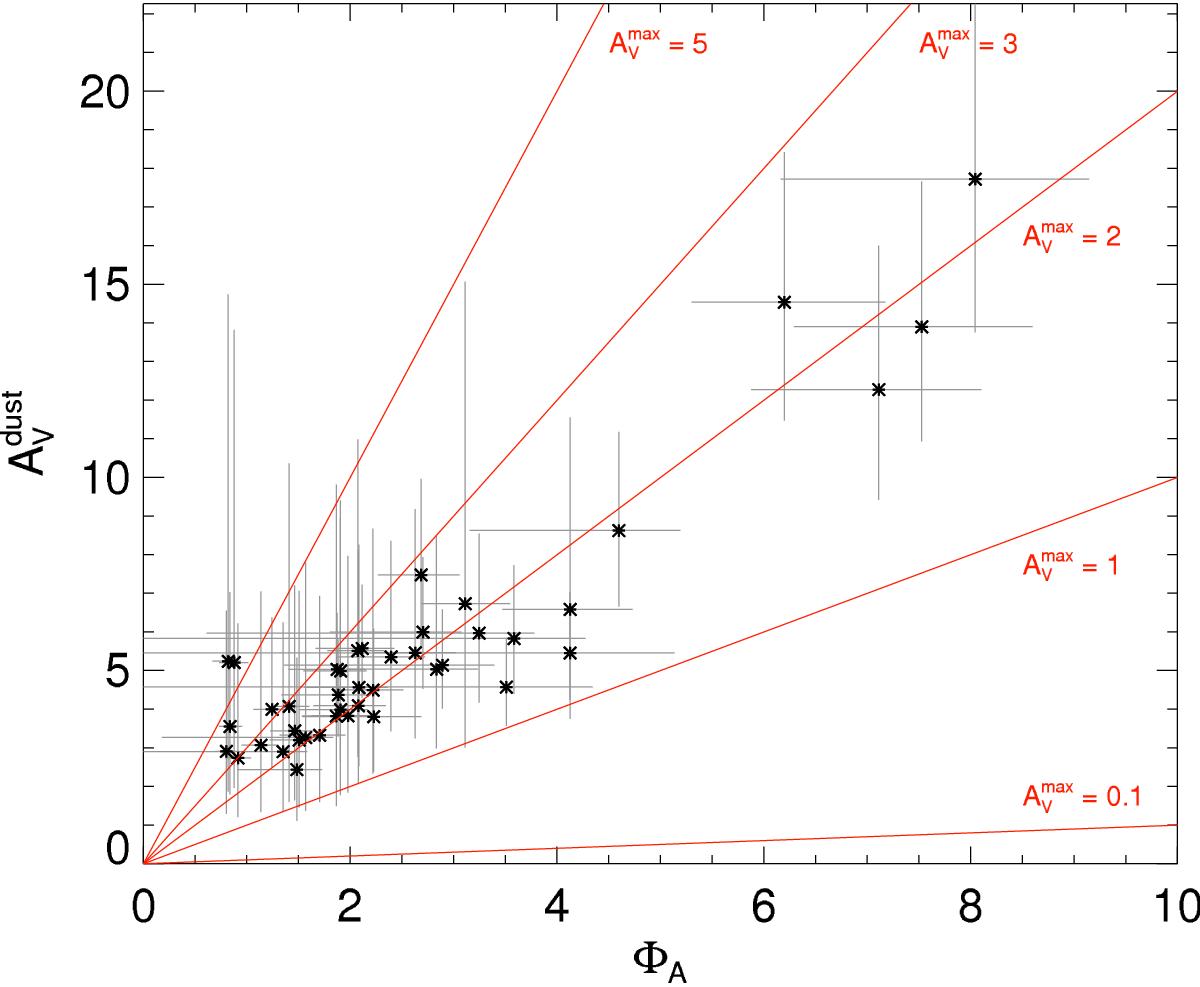
Extinction derived from the dust mass ![]() is plotted against the filling factor ΦA. The diagonal lines show different values of the extinction in individual PDR clouds (
is plotted against the filling factor ΦA. The diagonal lines show different values of the extinction in individual PDR clouds (![]() ). The data points agree with
). The data points agree with ![]() for
for ![]() ~ 1–3.
~ 1–3.
Current usage metrics show cumulative count of Article Views (full-text article views including HTML views, PDF and ePub downloads, according to the available data) and Abstracts Views on Vision4Press platform.
Data correspond to usage on the plateform after 2015. The current usage metrics is available 48-96 hours after online publication and is updated daily on week days.
Initial download of the metrics may take a while.