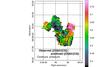
Fig. 16
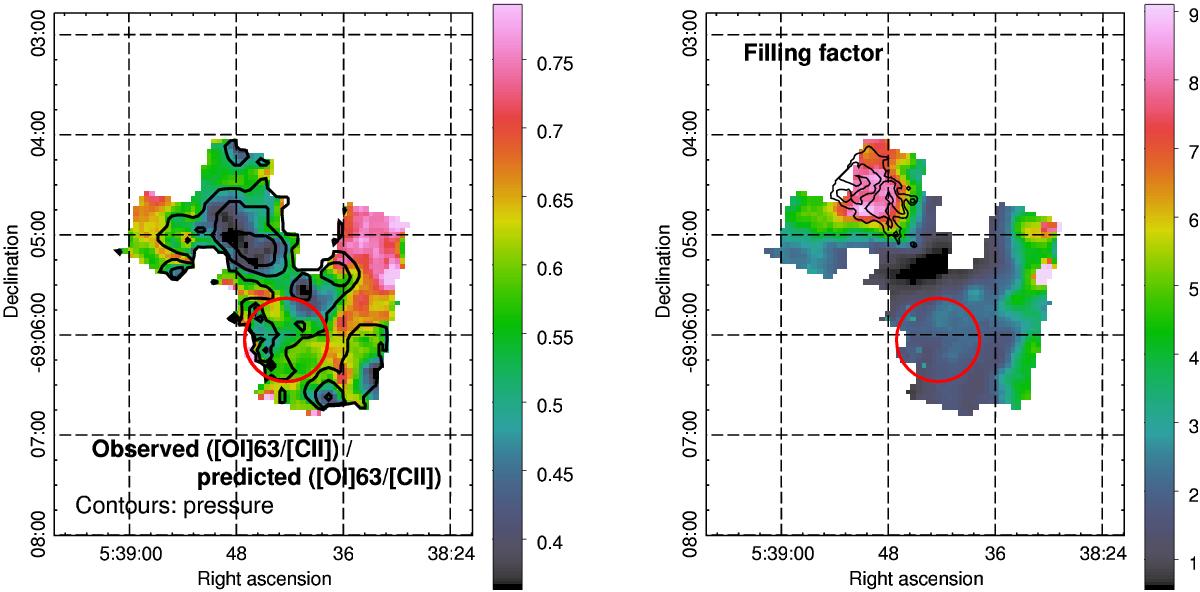
Left: ratio of the observed [O i] 63 μm/[C ii] ratio over the predicted [O i] 63 μm/[C ii] ratio (color bar). The pressure contours of between 4.5 × 10⁵ and 1.3 × 106 cm-3 K are indicated in black. The red circle shows the location of R136. Right: filling factor ΦA between 0.6 and 9 (color bar). The lowest values are at the peak of GUV. The black contours represent the 12CO(2–1) emission from ALMA (Indebetouw et al. 2013)
Current usage metrics show cumulative count of Article Views (full-text article views including HTML views, PDF and ePub downloads, according to the available data) and Abstracts Views on Vision4Press platform.
Data correspond to usage on the plateform after 2015. The current usage metrics is available 48-96 hours after online publication and is updated daily on week days.
Initial download of the metrics may take a while.