Free Access
Fig. 15
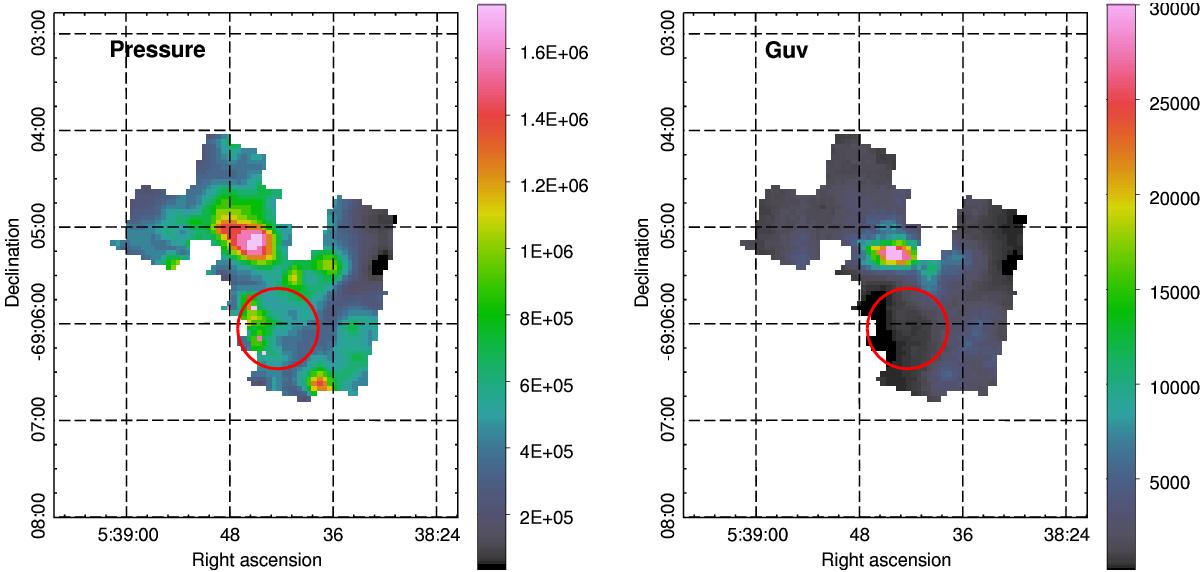
Left: best pressure map (cm-3 K) of the 30Dor region; using ([O i] 145 μm+[C ii])/![]() and [O i] 145 μm/[C ii]. The total extinction for this model is
and [O i] 145 μm/[C ii]. The total extinction for this model is ![]() = 3. Right: best GUV map (color bar in units of the Mathis field) for the same model. The red circle shows the location of R136.
= 3. Right: best GUV map (color bar in units of the Mathis field) for the same model. The red circle shows the location of R136.
This figure is made of several images, please see below:
Current usage metrics show cumulative count of Article Views (full-text article views including HTML views, PDF and ePub downloads, according to the available data) and Abstracts Views on Vision4Press platform.
Data correspond to usage on the plateform after 2015. The current usage metrics is available 48-96 hours after online publication and is updated daily on week days.
Initial download of the metrics may take a while.