Fig. 13
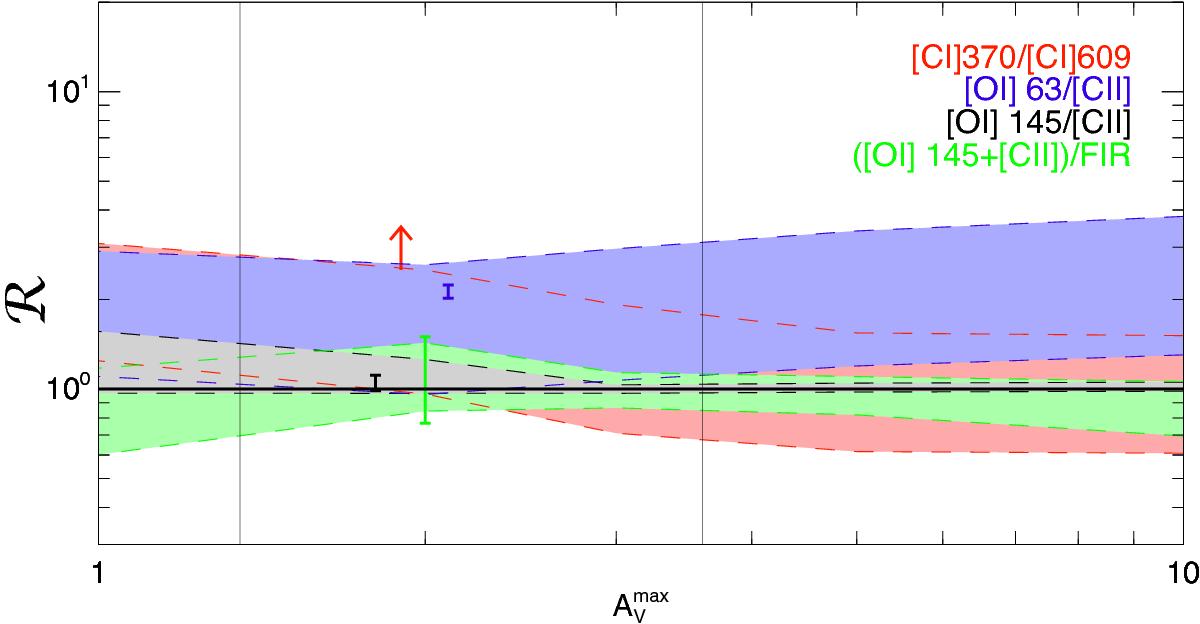
Ratios, ℛ, of the modeled line ratios over the observed line ratios for [C i] 370 μm/[C i] 609 μm, [O i] 63 μm/[C ii], [O i] 145 μm/[C ii], and ([O i] 145 μm+[C ii])/![]() , for simulated clouds of different
, for simulated clouds of different ![]() from 1 to 10 for 30Dor abundances. The width of the bands represents the dispersion of ℛ throughout the map. The error bars due to uncertainties on the observations are plotted. The vertical lines indicate the range of
from 1 to 10 for 30Dor abundances. The width of the bands represents the dispersion of ℛ throughout the map. The error bars due to uncertainties on the observations are plotted. The vertical lines indicate the range of ![]() where the predictions of the model are compatible with the observed [C ii]/CO(3–2) (see Fig. 17).
where the predictions of the model are compatible with the observed [C ii]/CO(3–2) (see Fig. 17).
Current usage metrics show cumulative count of Article Views (full-text article views including HTML views, PDF and ePub downloads, according to the available data) and Abstracts Views on Vision4Press platform.
Data correspond to usage on the plateform after 2015. The current usage metrics is available 48-96 hours after online publication and is updated daily on week days.
Initial download of the metrics may take a while.