Fig. 1
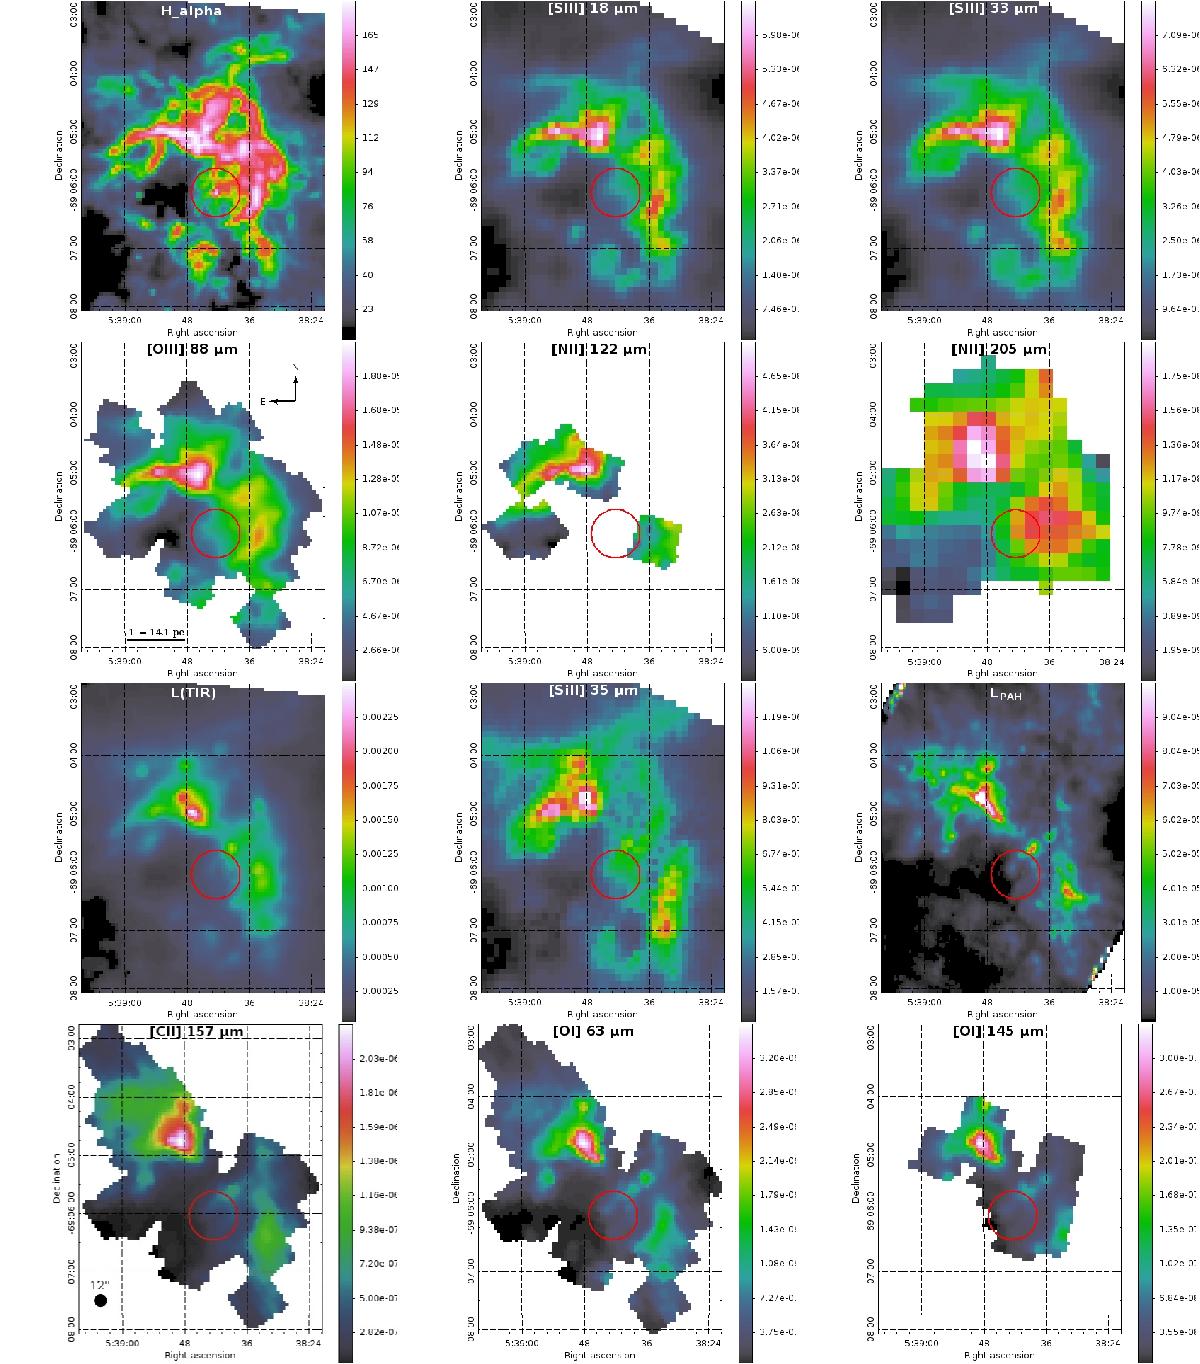
Maps of PDR and ionized gas tracers from Herschel (PACS and SPIRE/FTS) and Spitzer/IRS observations of the 30Dor region in W m-2 sr-1.The maps are shown at their original spatial resolution. The LTIR map is the total infrared luminosity integrated between 3–1000 μm from our SED modeling. The red circle represents the location of the R136 cluster. Table 1 and Sect. 2 describe these observations in detail.
Current usage metrics show cumulative count of Article Views (full-text article views including HTML views, PDF and ePub downloads, according to the available data) and Abstracts Views on Vision4Press platform.
Data correspond to usage on the plateform after 2015. The current usage metrics is available 48-96 hours after online publication and is updated daily on week days.
Initial download of the metrics may take a while.