Fig. 5
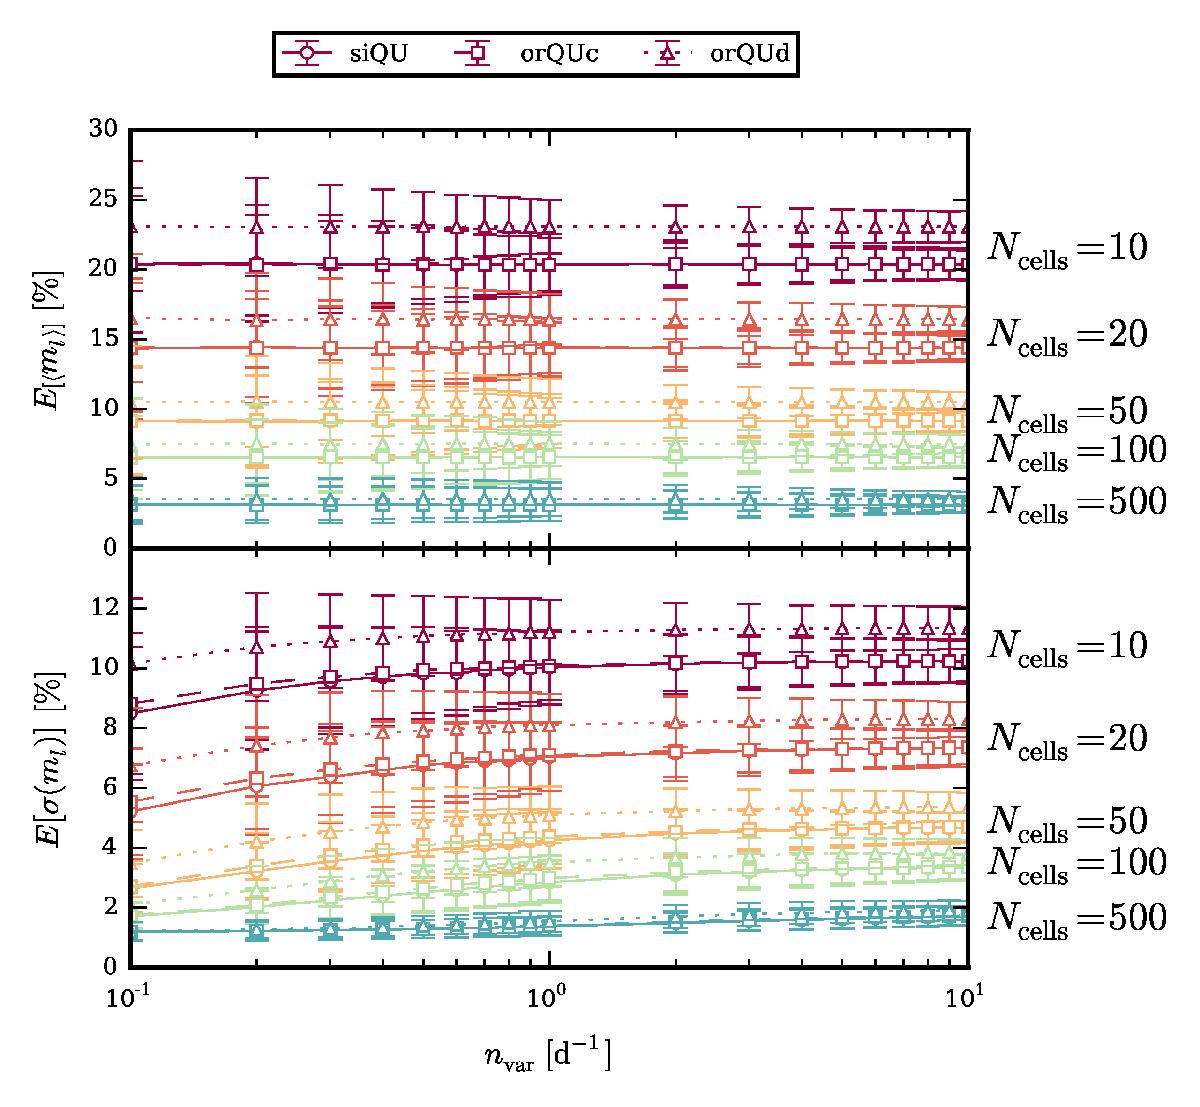
Expectation values of the polarization fraction mean (upper panel) and standard deviation (lower panel) for different numbers of cells depending on the cell variation rate. Each data point is based on 10 000 simulations. Solid curves and circles correspond to the siQU model, dashed curves and squares to the orQUc model, and dotted curves and triangles to the orQUd model.
Current usage metrics show cumulative count of Article Views (full-text article views including HTML views, PDF and ePub downloads, according to the available data) and Abstracts Views on Vision4Press platform.
Data correspond to usage on the plateform after 2015. The current usage metrics is available 48-96 hours after online publication and is updated daily on week days.
Initial download of the metrics may take a while.