Fig. 1
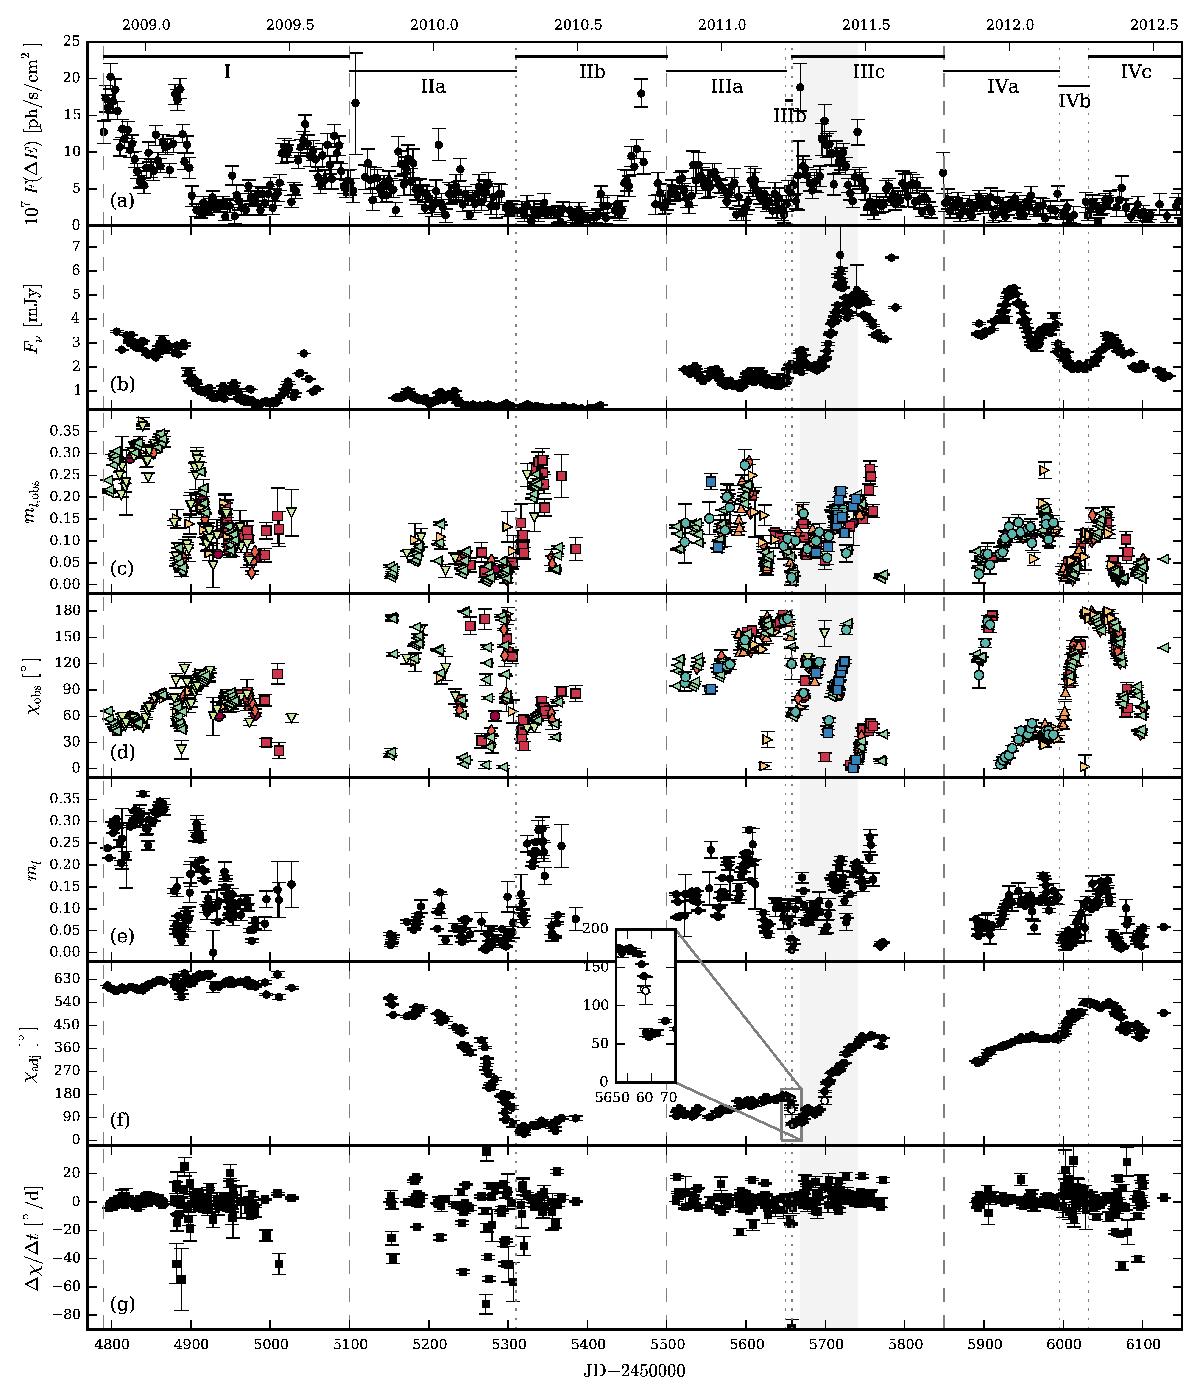
Optical photometry and polarimetry and γ-ray light curve of 3C 279. Fermi-LAT γ-ray light curve at > 100 MeV binned into 3 day intervals (panel a)) as published in Hayashida et al. (2015). Combined R-band light curve (panel b)). Measured, optical polarization fraction (panel c)) and EVPA (panel d)); red circles: Calar Alto (R), red squares: CrAO-70 cm (R), red diamonds: Perkins (R), orange up-sided triangles: SPM (R), orange right-sided triangles: St. Petersburg (R), green down-sided triangles: KANATA (V), green left-sided triangles: Steward Obs. (spec. and V), blue circles: Liverpool (V+R), blue squares: KVA (white light). Combined, de-biased, and averaged polarization fraction (panel e)). Combined, averaged, and adjusted EVPA (panel f)); open symbols are added from the non-averaged EVPA curve. Pointwise, local derivative of the adjusted EVPA (panel g)). The grey area highlights the period of γ-ray flaring activity coinciding with a rotation of the optical polarization angle.
Current usage metrics show cumulative count of Article Views (full-text article views including HTML views, PDF and ePub downloads, according to the available data) and Abstracts Views on Vision4Press platform.
Data correspond to usage on the plateform after 2015. The current usage metrics is available 48-96 hours after online publication and is updated daily on week days.
Initial download of the metrics may take a while.