Fig. 8
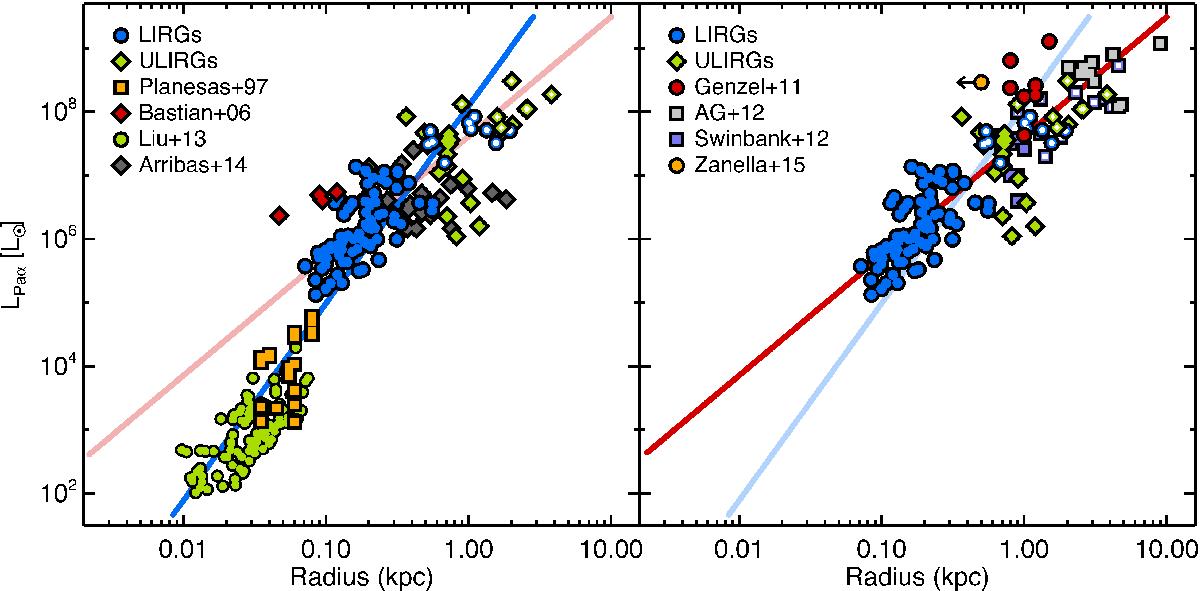
Dependence of the extinction-corrected LPaα with the radius of individual star-forming clumps and galaxies. The individual regions of LIRGs and ULIRGs are plotted as blue circles and green diamonds, respectively, whereas the integrated measurements of each object of our sample are marked using hollow symbols. Uncertainties at 1σ level of the LIRG and ULIRG measurements are smaller than the size of the symbols. We show the comparison with local samples (left) and high-z samples (right). Further details on the local and high-z samples can be found in Table 4. The blue and red lines correspond to power law fits LPaα ~ rη to our data of local LIRG and ULIRG clumps, together with the local samples (η = 3.04) and high-z points (η = 1.88), respectively.
Current usage metrics show cumulative count of Article Views (full-text article views including HTML views, PDF and ePub downloads, according to the available data) and Abstracts Views on Vision4Press platform.
Data correspond to usage on the plateform after 2015. The current usage metrics is available 48-96 hours after online publication and is updated daily on week days.
Initial download of the metrics may take a while.