Fig. 5
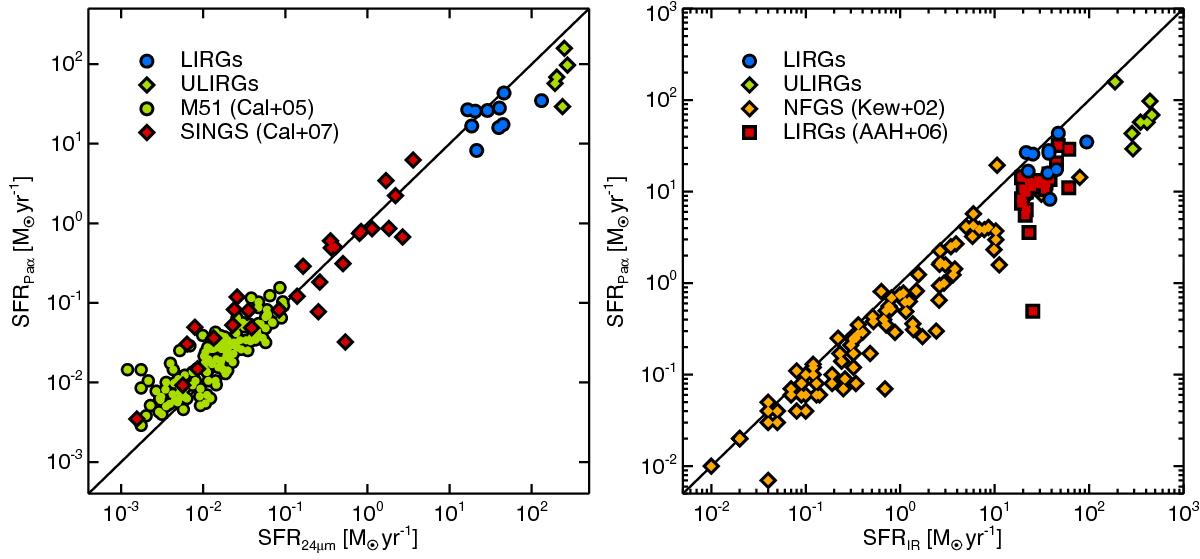
Left: comparison of the extinction-corrected SFRPaα with the monochromatic SFR24 μm. The blue circles and green diamonds correspond to our local LIRGs and ULIRGs, respectively. The green circles are data of M51 individual star-forming regions from Calzetti et al. (2005) and the red diamonds correspond to data from Calzetti et al. (2007) of SINGS galaxies. Right: comparison of extinction-corrected Paα luminosity and LIR. Our LIRG and ULIRG samples are plotted as blue circles and green diamonds, respectively, orange diamonds are data from Kewley et al. (2002) of normal galaxies from the NFGS, while red squares correspond to local LIRGs from Alonso-Herrero et al. (2006). In both panels, the black lines correspond to a one-to-one ratio. Uncertainties at 1σ level of the Paα measurements are smaller than the size of the symbols.
Current usage metrics show cumulative count of Article Views (full-text article views including HTML views, PDF and ePub downloads, according to the available data) and Abstracts Views on Vision4Press platform.
Data correspond to usage on the plateform after 2015. The current usage metrics is available 48-96 hours after online publication and is updated daily on week days.
Initial download of the metrics may take a while.