Fig. 4
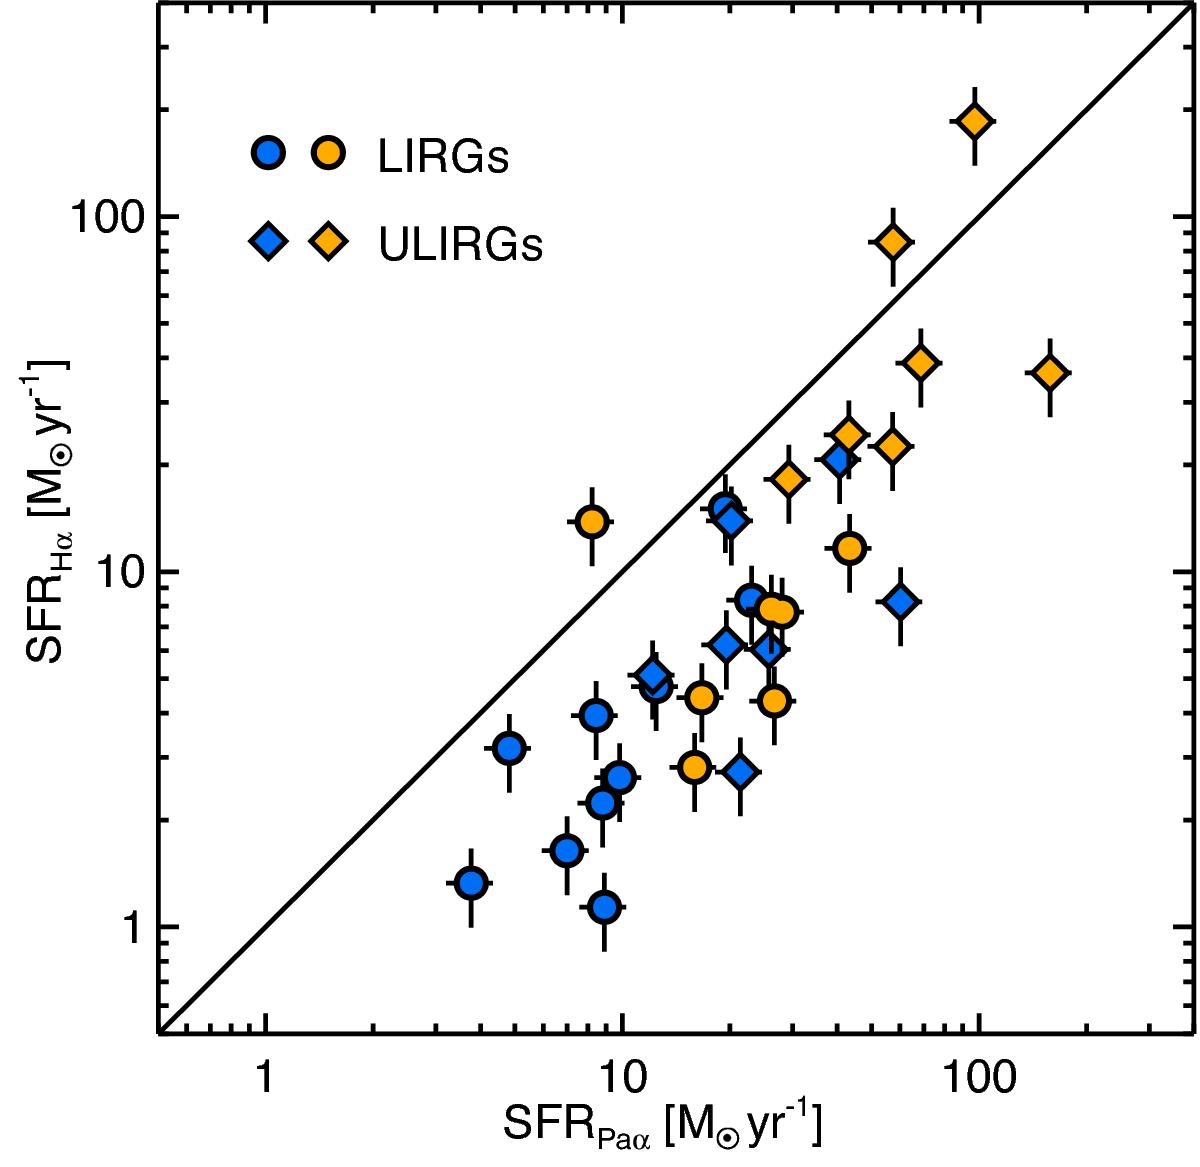
Comparison of star formation rates derived from Hα and Paα observed (blue) and extinction-corrected (yellow) luminosities for LIRGs (circles) and ULIRGs (diamonds). The solid black line represents a one-to-one ratio. The SFR has been corrected using its corresponding AV correction, i.e. SFRHα is corrected using optical measurements of AV, and SFRPaα is corrected using the near-IR lines. The Hα luminosities are extracted from García-Marín et al. (2009) and Rodriguez-Zaurín et al. (2011).Uncertainties at 1σ level are represented as black lines.
Current usage metrics show cumulative count of Article Views (full-text article views including HTML views, PDF and ePub downloads, according to the available data) and Abstracts Views on Vision4Press platform.
Data correspond to usage on the plateform after 2015. The current usage metrics is available 48-96 hours after online publication and is updated daily on week days.
Initial download of the metrics may take a while.