Fig. 3
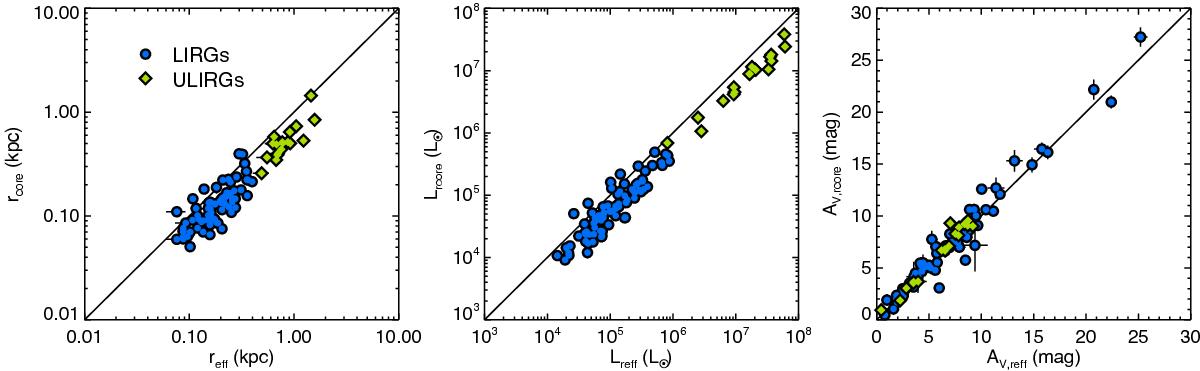
Comparison between the radius (left), observed line luminosity (centre), and visual extinction (right) of individual clumps in LIRGs (blue) and ULIRGs (green), measured using the effective radius and core radius methods. Uncertainties at 1σ level are represented as black lines. The thick black lines represent a one-to-one ratio in all the panels.
Current usage metrics show cumulative count of Article Views (full-text article views including HTML views, PDF and ePub downloads, according to the available data) and Abstracts Views on Vision4Press platform.
Data correspond to usage on the plateform after 2015. The current usage metrics is available 48-96 hours after online publication and is updated daily on week days.
Initial download of the metrics may take a while.