Fig. B.11
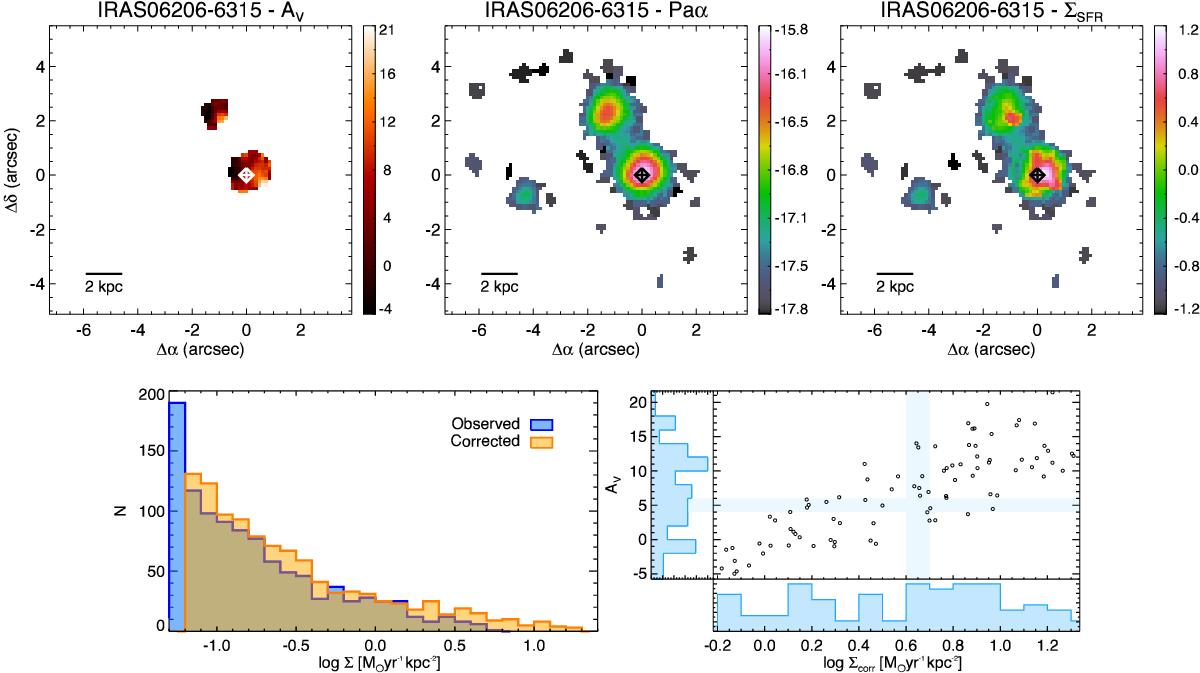
IRAS 06206-6315. Top panels show the AV map derived from the Paα at 1.876μm and Brγ at 2.166μm line ratio, the observed maps of the Paα emission, together with the star formation rate surface density (ΣSFR) map, corrected from extinction. Units are [mag], log[erg s-1 cm-2], and [M⊙ yr-1 kpc-2], respectively. The nucleus and Paα peak are marked with a plus sign (+) and a diamond (◇), respectively. The main nucleus is defined as the brightest spaxel of the SINFONI K-band image (Paper I), and the Brγ (Paα) peak corresponds to the brightest spaxel of the corresponding emission map. Bottom left panel shows the observed (blue histogram) and the corrected-from-extinction (yellow histogram) ΣSFR spaxel-by-spaxel distributions. The relationship between the corrected ΣSFR values and the AV is shown in the bottom right panel only for those points with a spaxel-by-spaxel correction of the extinction. The blue histograms show the projected distribution onto each axis and are arbitrarily normalised, whereas the blue lines are the median of each distribution.
Current usage metrics show cumulative count of Article Views (full-text article views including HTML views, PDF and ePub downloads, according to the available data) and Abstracts Views on Vision4Press platform.
Data correspond to usage on the plateform after 2015. The current usage metrics is available 48-96 hours after online publication and is updated daily on week days.
Initial download of the metrics may take a while.